


 187 / 762

Chapter 5: Bivariate Data
187
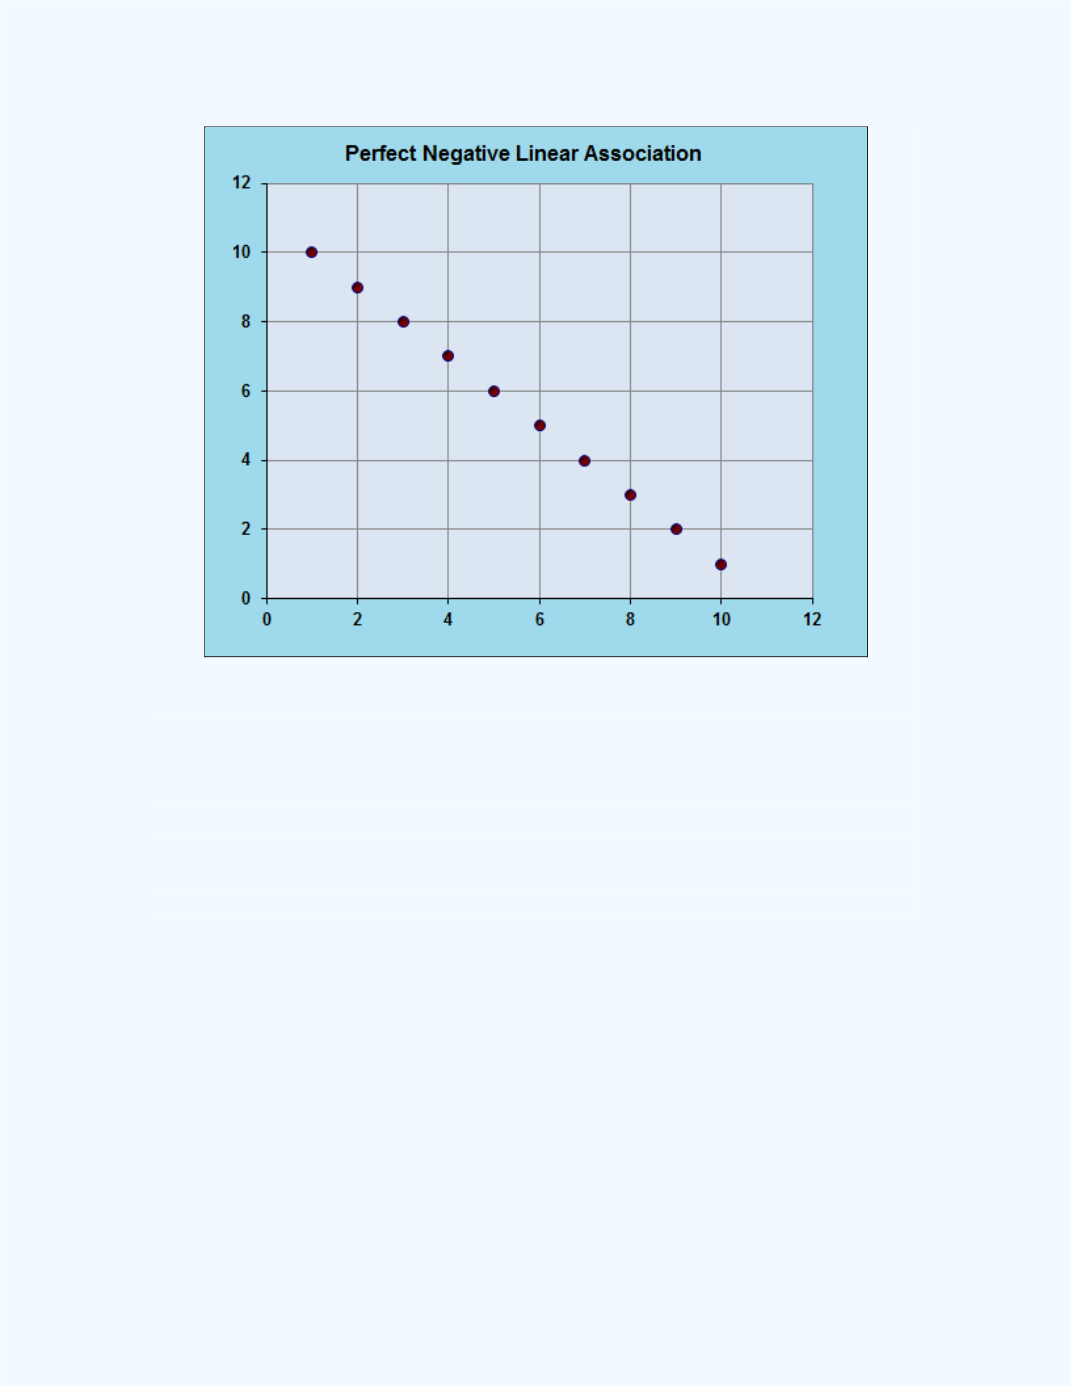
Figure 5-3:
Perfect negative linear association
Figure 5-4
shows variables that are positively related. The values are not on
a straight line, but are somewhat closely packed together in a linear manner,
and so one could possibly say that there is a “strong” positive linear
association between the two variables. We will define what we mean by
“strong” in a later discussion.