


 190 / 762

190
Chapter 5: Bivariate Data
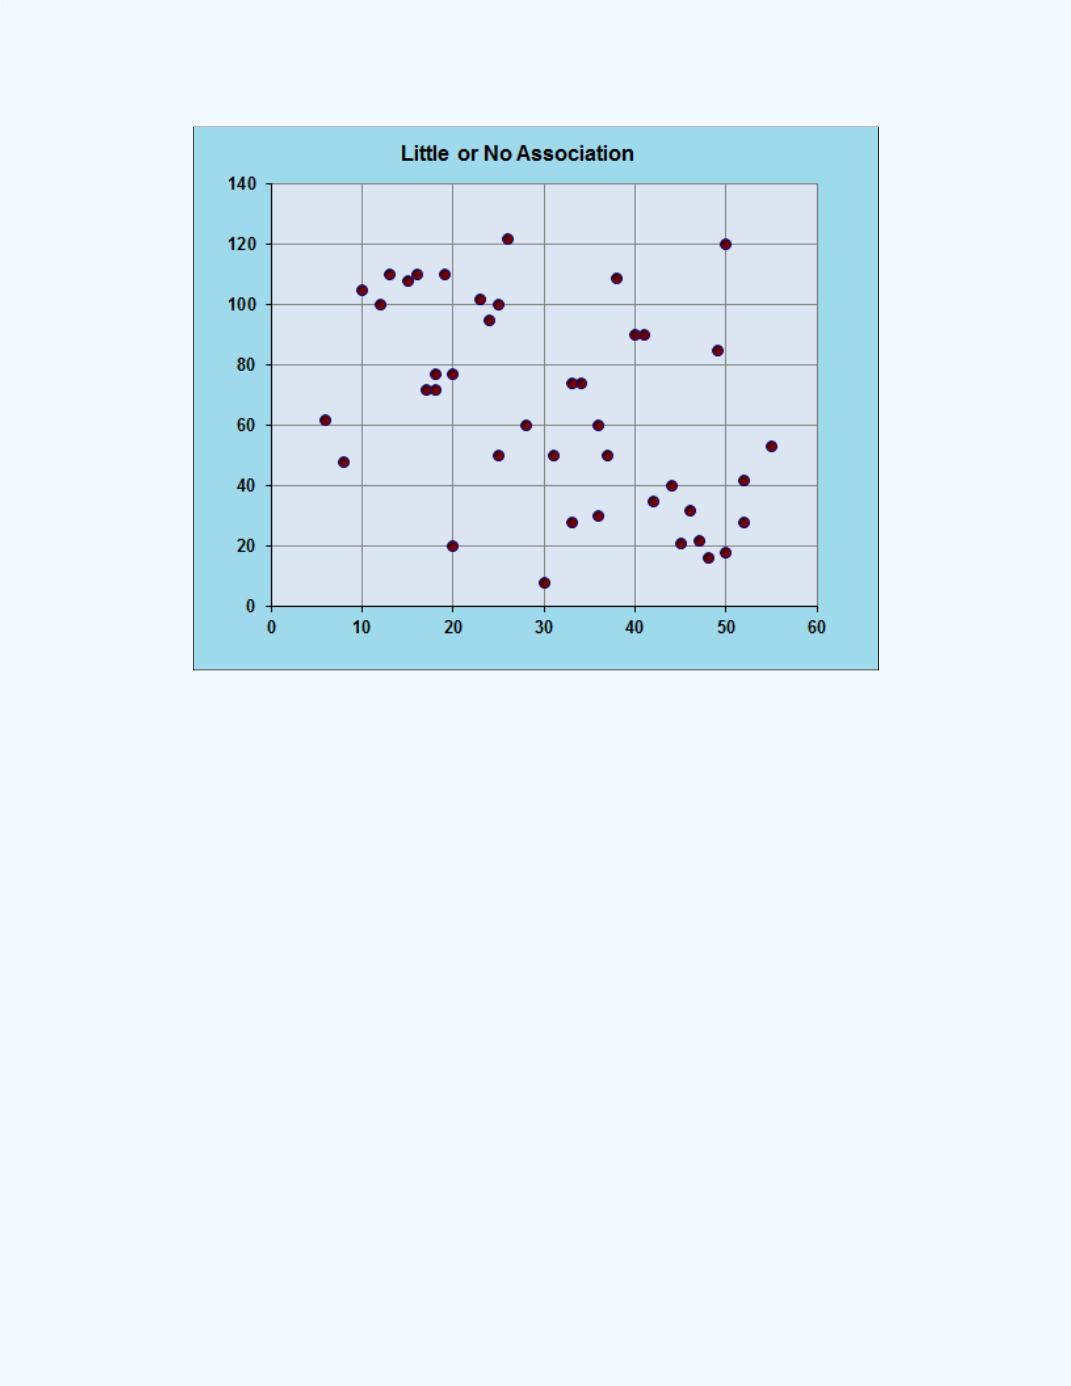
Figure 5-6:
Little or No association
Figure 5-7
does not show any noticeable linear pattern. The scatter plot
displays an example of a nonlinear or a curvilinear relationship. We will not
study such relationships in this text but will only concentrate on linear
relationships between two variables.