


 195 / 762

Chapter 5: Bivariate Data
195
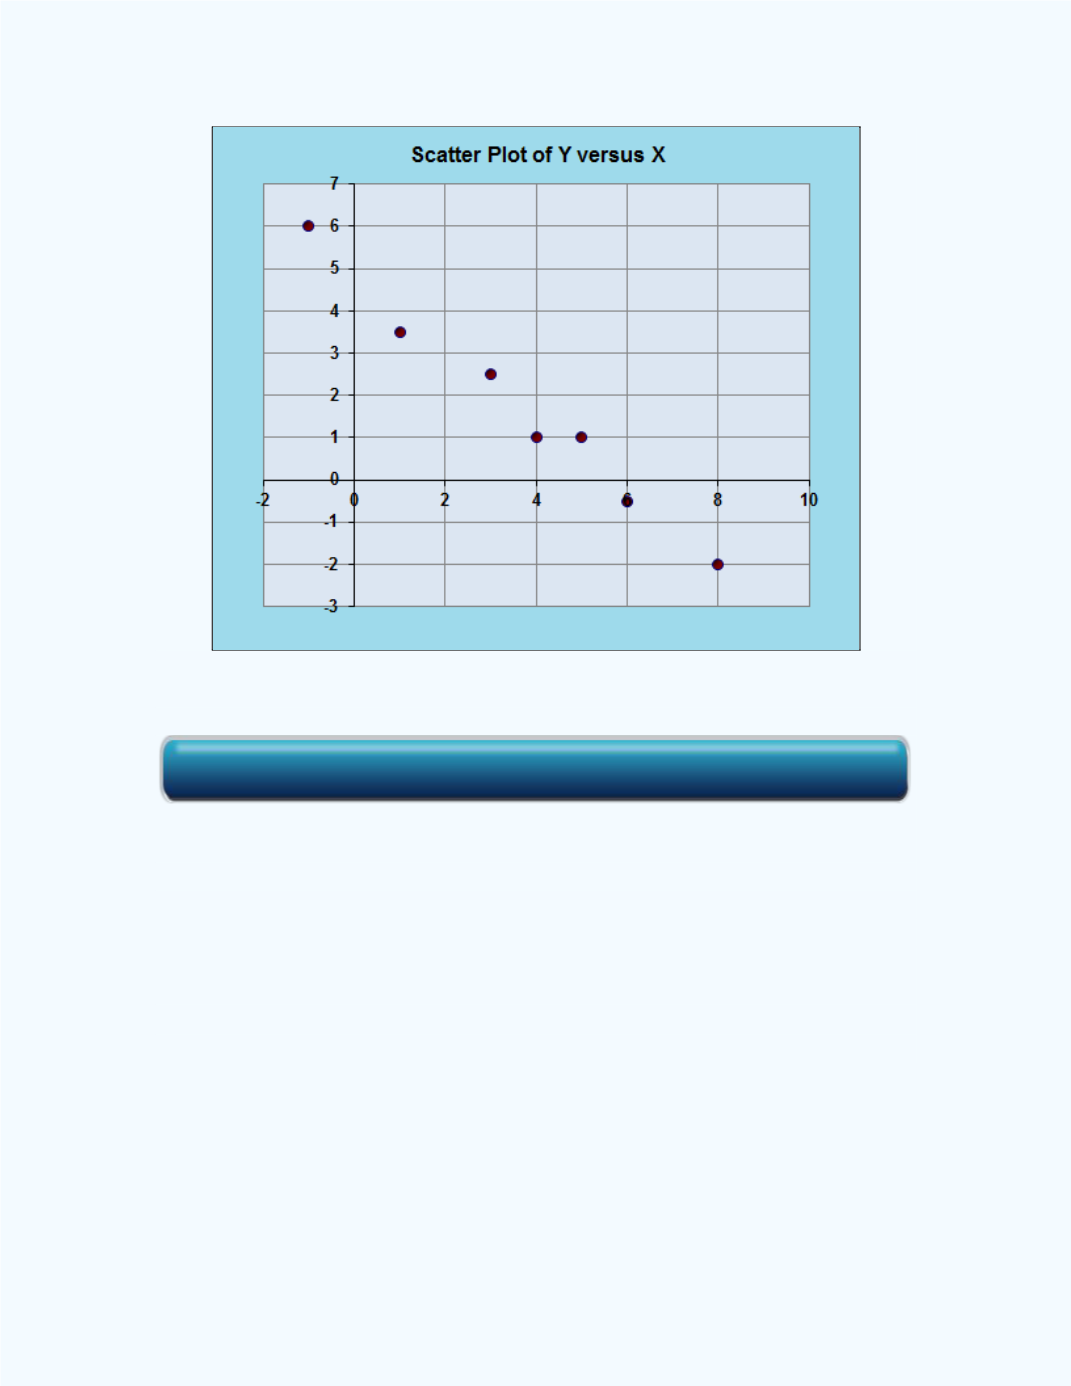
Figure 5-9:
Scatter Plot for
Example 5-2
Following, is a summary of the properties of the linear correlation
coefficient.
Properties of the Correlation Coefficient
The correlation coefficient ranges in values from –1 to +1.
If there is a perfect positive linear relationship between the variables, the
value of
will be equal to +1. See
Figure 5-10
.
Click here for the Scatter Plot and Correlation Workbook