


 198 / 762

198
Chapter 5: Bivariate Data
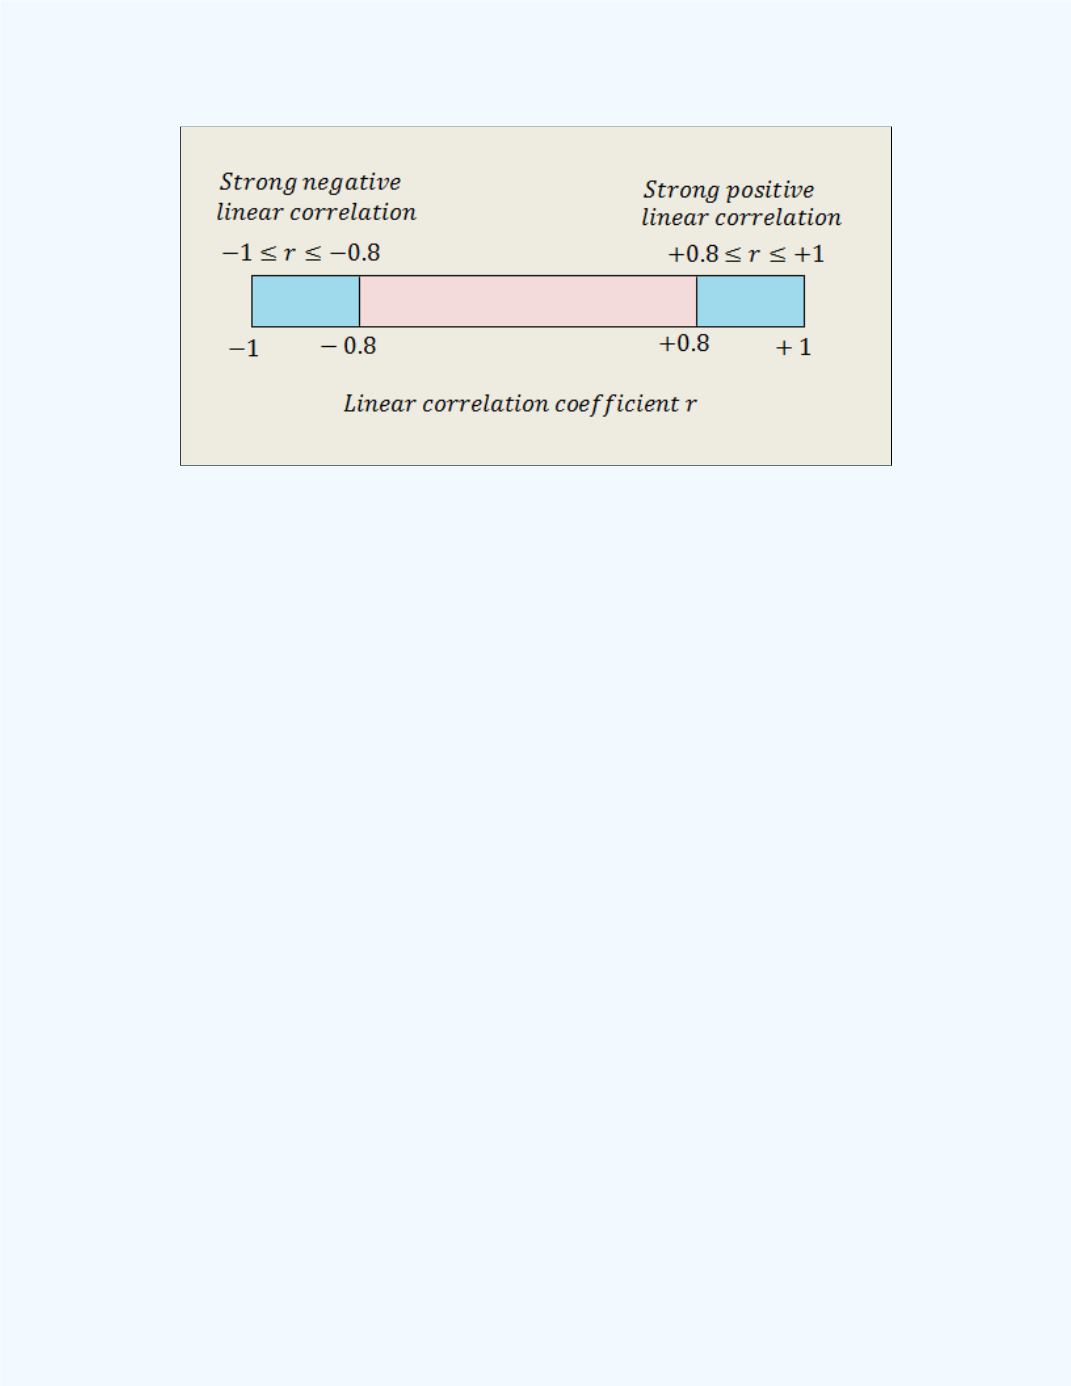
Figure 5-12:
Ranges for a strong negative or positive linear
correlation coefficient
r
A more detailed interpretation of the linear correlation coefficient is
given by the following
Rule of Thumb
.
Note:
There are several “rules of thumb” about how to interpret the
linear correlation coefficient. The one listed below, is just one of the
many. They vary slightly from each other, but generally infer the same
thing.
General Rule of Thumb:
Interpretation of the Correlation
Coefficients
-1
-0.8
strong negative linear relationship;
+0.8
+1
strong positive linear relationship.
-0.80 <
-0.6
moderately high negative linear relationship;
+0.6
< +0.80
moderately high positive linear relationship.
-0.60 <
-0.4
moderate negative linear relationship;
+0.4
< 0.60
moderate positive linear relationship.
-0.40 <
-0.2
low negative linear relationship;
+0.2
< +0.40
low positive linear relationship.
-0.20 <
< +0.20
little or no linear relationship.