


 199 / 762

Chapter 5: Bivariate Data
199
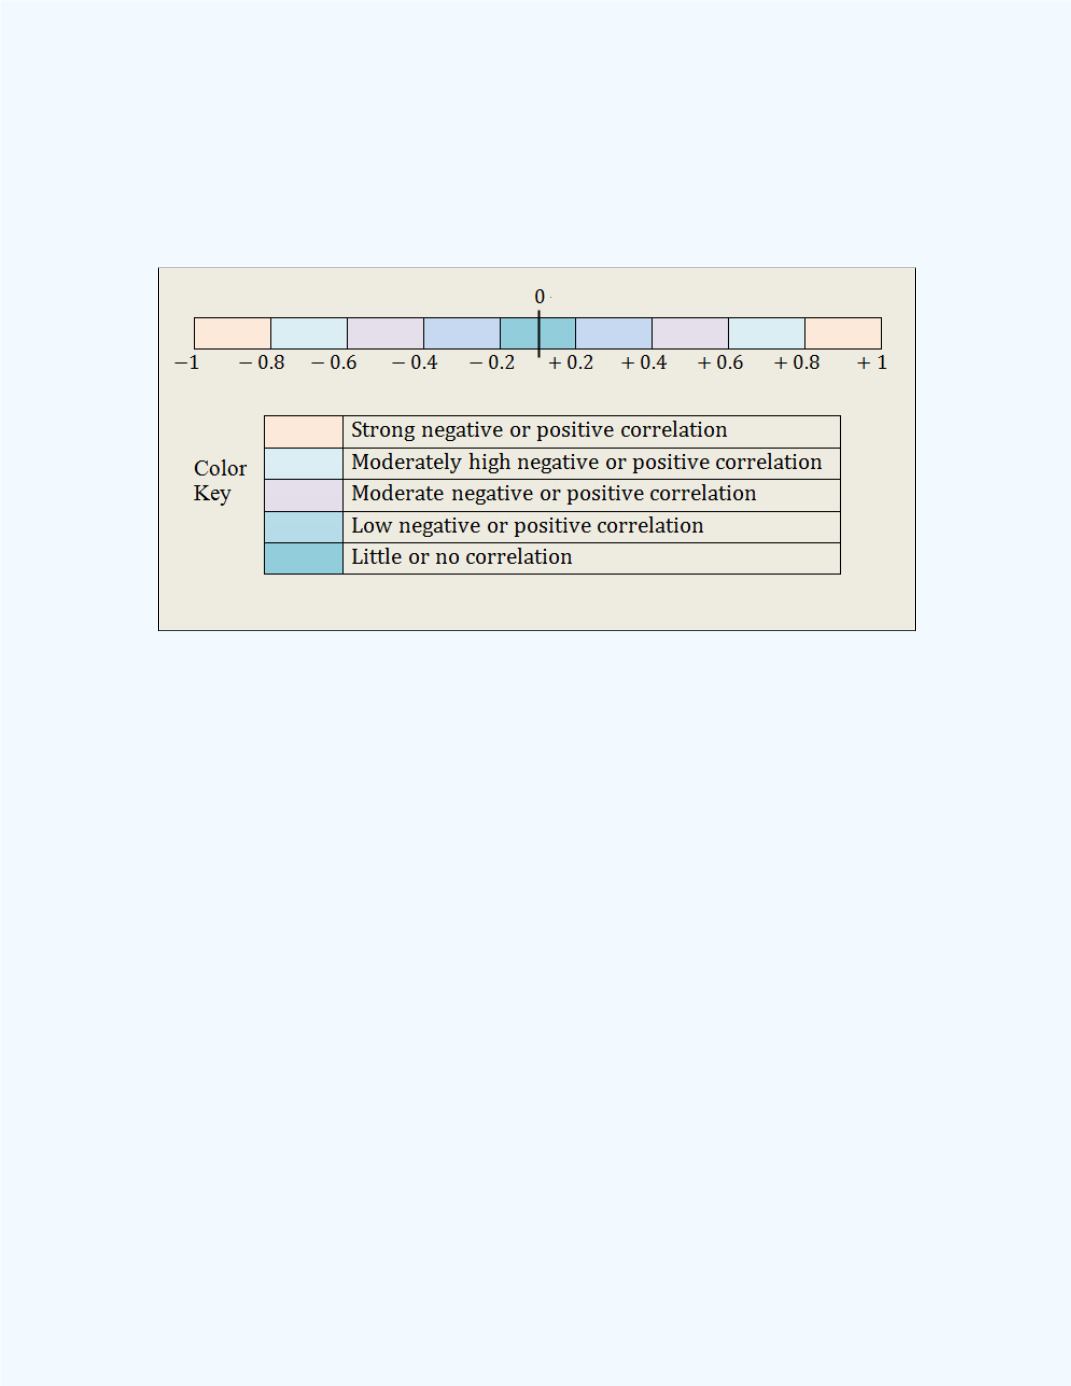
A pictorial representation of this
General Rule of Thumb
is presented in
Figure 5-13
. Care must be taken in interpreting the end points of the colored
intervals for the different degrees of correlation. You should always refer to
the intervals listed above.
Figure 5-13:
Pictorial Representation of the General Rule of
Thumb for the correlation coefficient
r
Now that the term “strong” has been defined with respect to linear
correlation, you may want to revisit
Section 5-3
and review the graphs
again.
So far we have discussed how to compute the linear correlation coefficient
for sample data. What about if you have population data? How would you
compute the population linear correlation coefficient?
The
population correlation coefficient
measures the strength and gives the
direction of a relationship between two variables using population data
values. The population correlation coefficient is denoted by the Greek letter
(read as “rho”) and is computed by using all possible (
) pairs taken
from the population.
The same formula that is used to compute the sample correlation coefficient
is used, except that all possible pairs of values (
) from the population are
now utilized.