


 205 / 762

Chapter 5: Bivariate Data
205
Trying to answer this question by just looking at the plot may be a futile
exercise.
The techniques in
regression analysis
allow us to determine which of the
three lines best represent the linear relationship. That is, regression analysis
allows us to model the data with the very best straight line without having to
guess. We would later use the model to help predict a value for the
dependent variable
y
for a given independent value
x
.
Definition: Regression Analysis
Regression analysis is a broad area in statistics which enables us to find the
model that best describes the relationship between two or more variables.
Least Squares Regression Line or Line of Best Fit
Again, we will restrict our discussions to linear associations. From algebra,
the equation of a straight line is usually given by
, where
is
the slope of the line and
is the
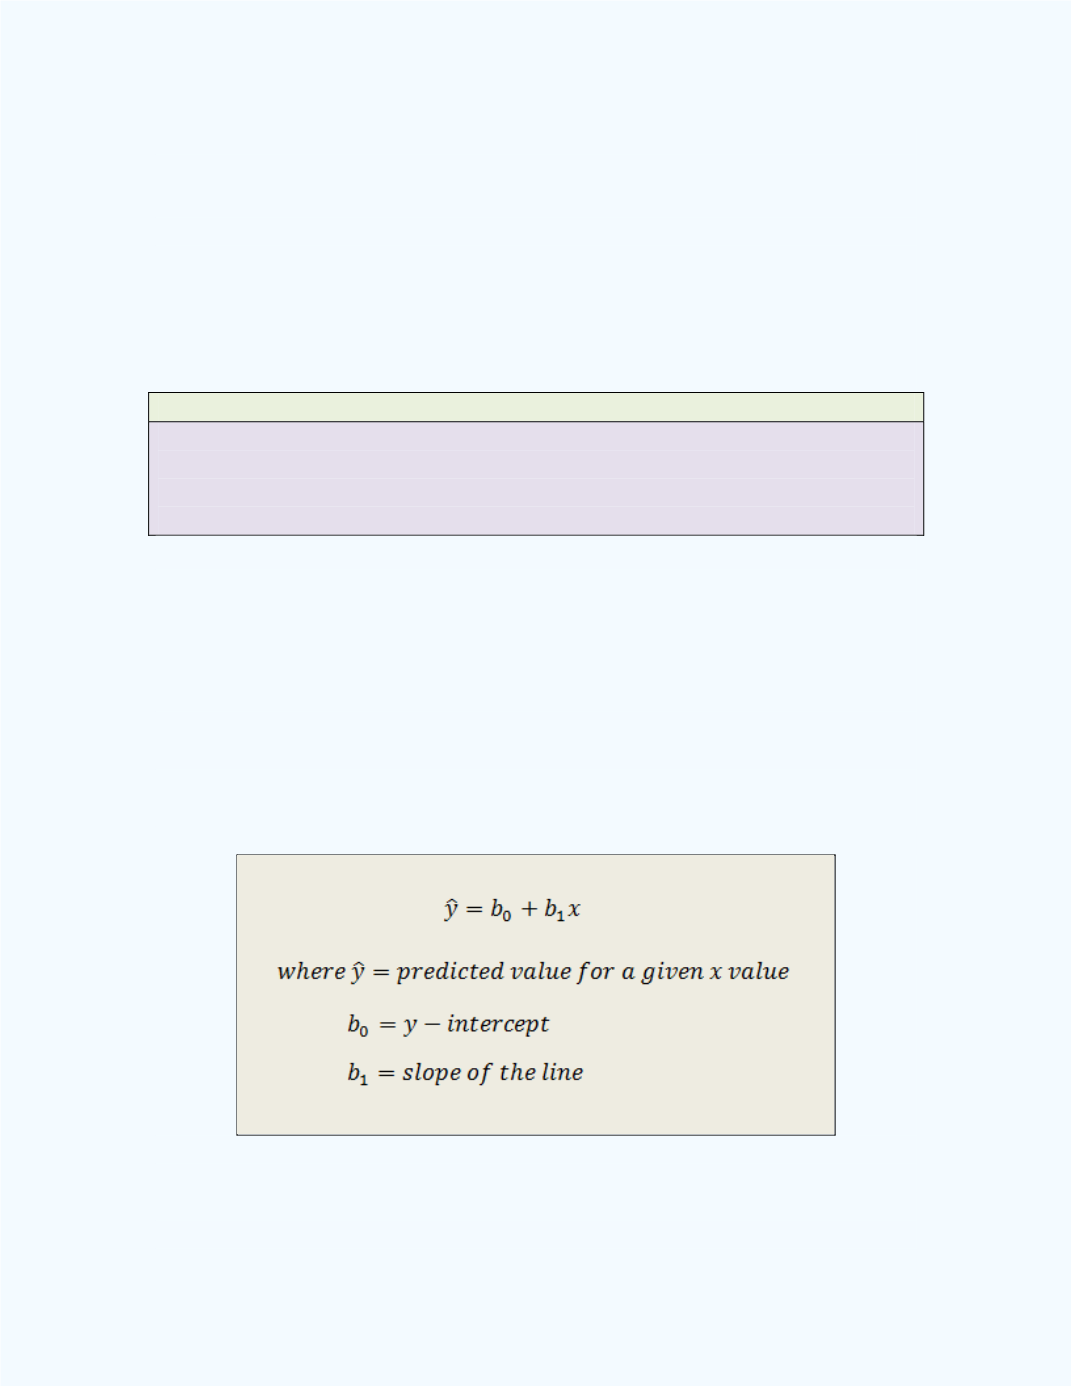
intercept. In elementary statistics, the
equation of the regression line is usually written as
̂
, where
is the
intercept,
is the slope of the line, and
̂
is read as “
y
-hat”, and it
gives the predicted
value for a given
value. That is, the prediction
equation is given as:
Least-squares analysis allows us to determine the values for
and
such
that the equation of the regression line best represents the relationship
between the two variables by minimizing the error sum of squares.