


 206 / 762

206
Chapter 5: Bivariate Data
The regression line is usually called the
line of best fit.
Following is a discussion explaining what we mean by minimizing the error
sum of squares.
Let us consider an observed ordered pair in the bivariate data set. Let this be
the
observed pair
(
)
in the data set. Note that
can vary up to the
total number of observed pairs in the data set. For instance, if we have 10
observed pairs, then the possible values for
are
= 1, 2, 3, …, 10.
Now, we can write
as
̂
where
̂
= mean of the population of the potential values of
when
is observed.
= error in the observed
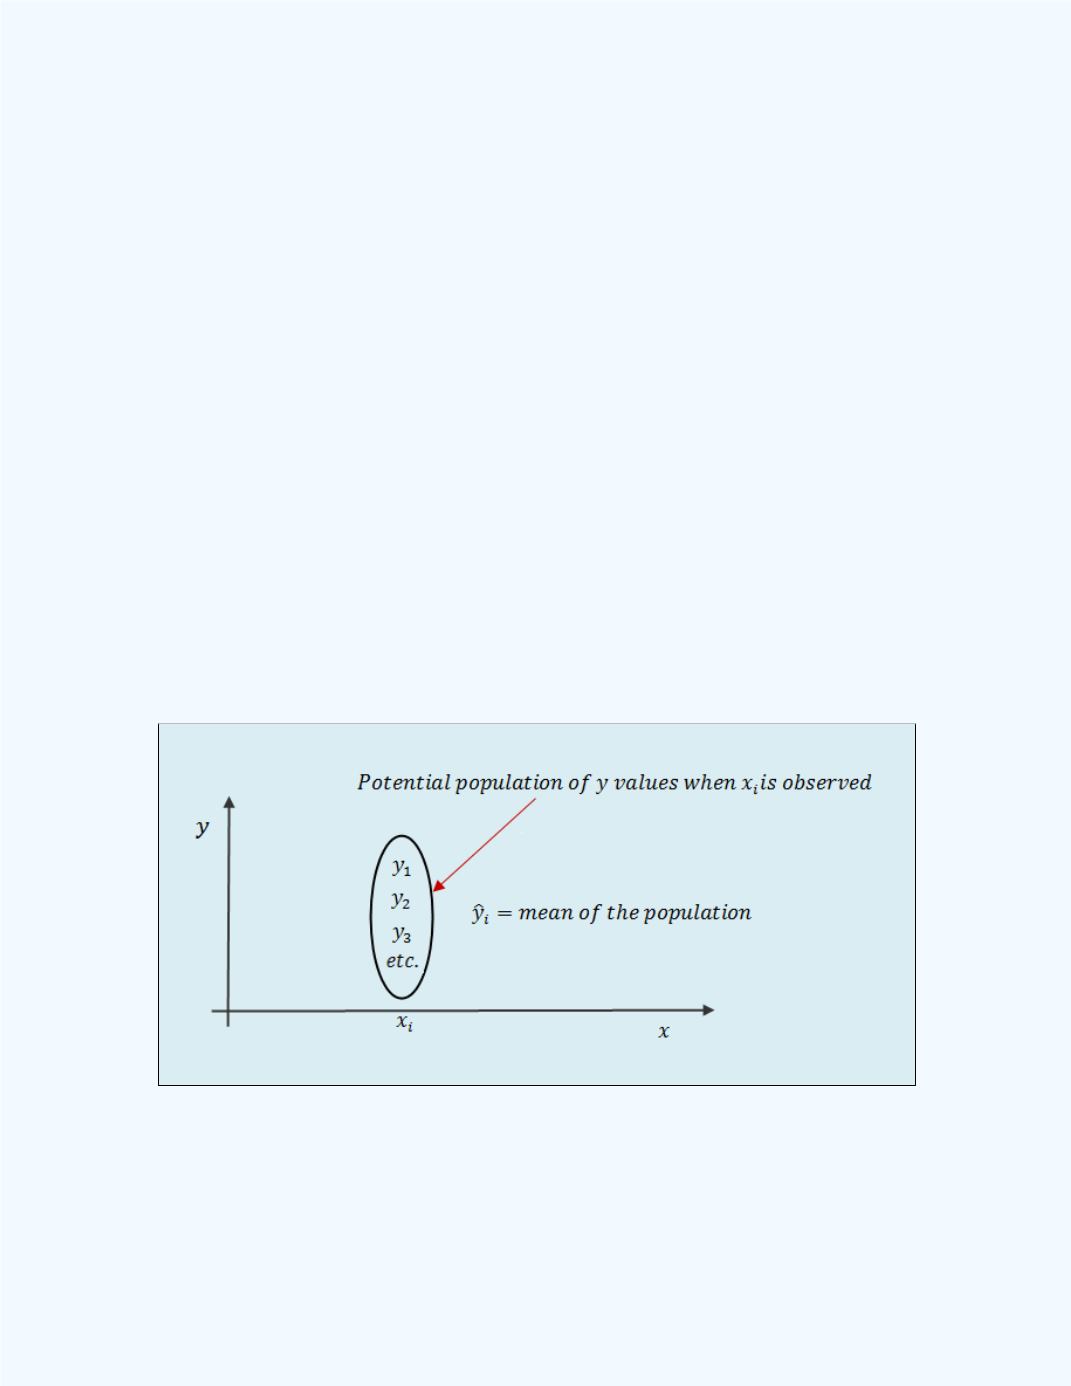
value.
A graphical representation
of the above, given in
Figure 5-17
,
shows the
potential population of
values when
is observed.
Figure 5-17:
Display of Potential Population of y values
for a given x value
Now, we can define a regression model by assuming these averages
̂
̂
̂
̂
etc.
are related to
etc
. by a straight line. Thus we
may describe this straight line by