


 207 / 762

Chapter 5: Bivariate Data
207
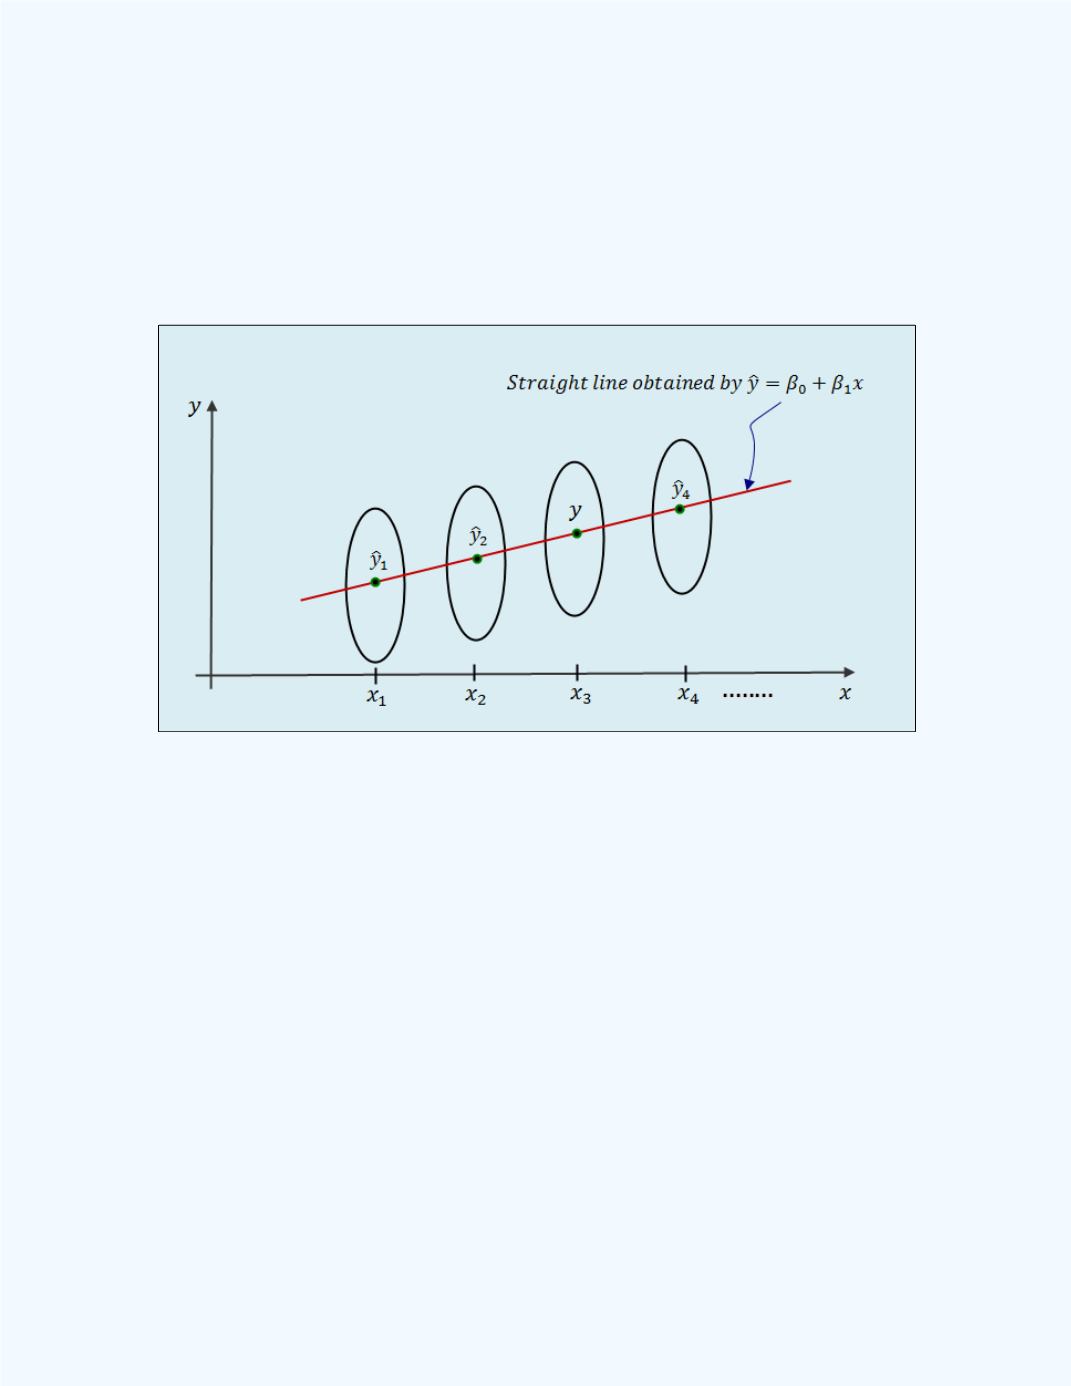
̂
where
and
are the parameters which represent the intercept and the
slope respectively. This is displayed in
Figure 5-18.
Figure 5-18:
The Straight Line Model Through the
Means of the Potential Populations
If we use the means as the predicted values then for any
value the
predicted value will be: