


 213 / 762

Chapter 5: Bivariate Data
213
̂
- 0.857
4 + 4.929 = 1.501.
That is, the predicted value of
is 1.501
when the independent value
= 4. Note, the ordered pair (4, 1.501) will be
a point located on the line of best fit. Observe that the value of 4 lies in the
experimental range for the
values as well.
Notes:
When using the line of best fit to make predictions, care must be taken
to use independent values that are within the range of the observed
independent variable.
Using values outside of the range of observed independent values may
lead to incorrect predictions because we do not know how the model
is behaving outside this range.
Note:
The model reflects the behavior of the association between the two variables
only within the range of the observed values.
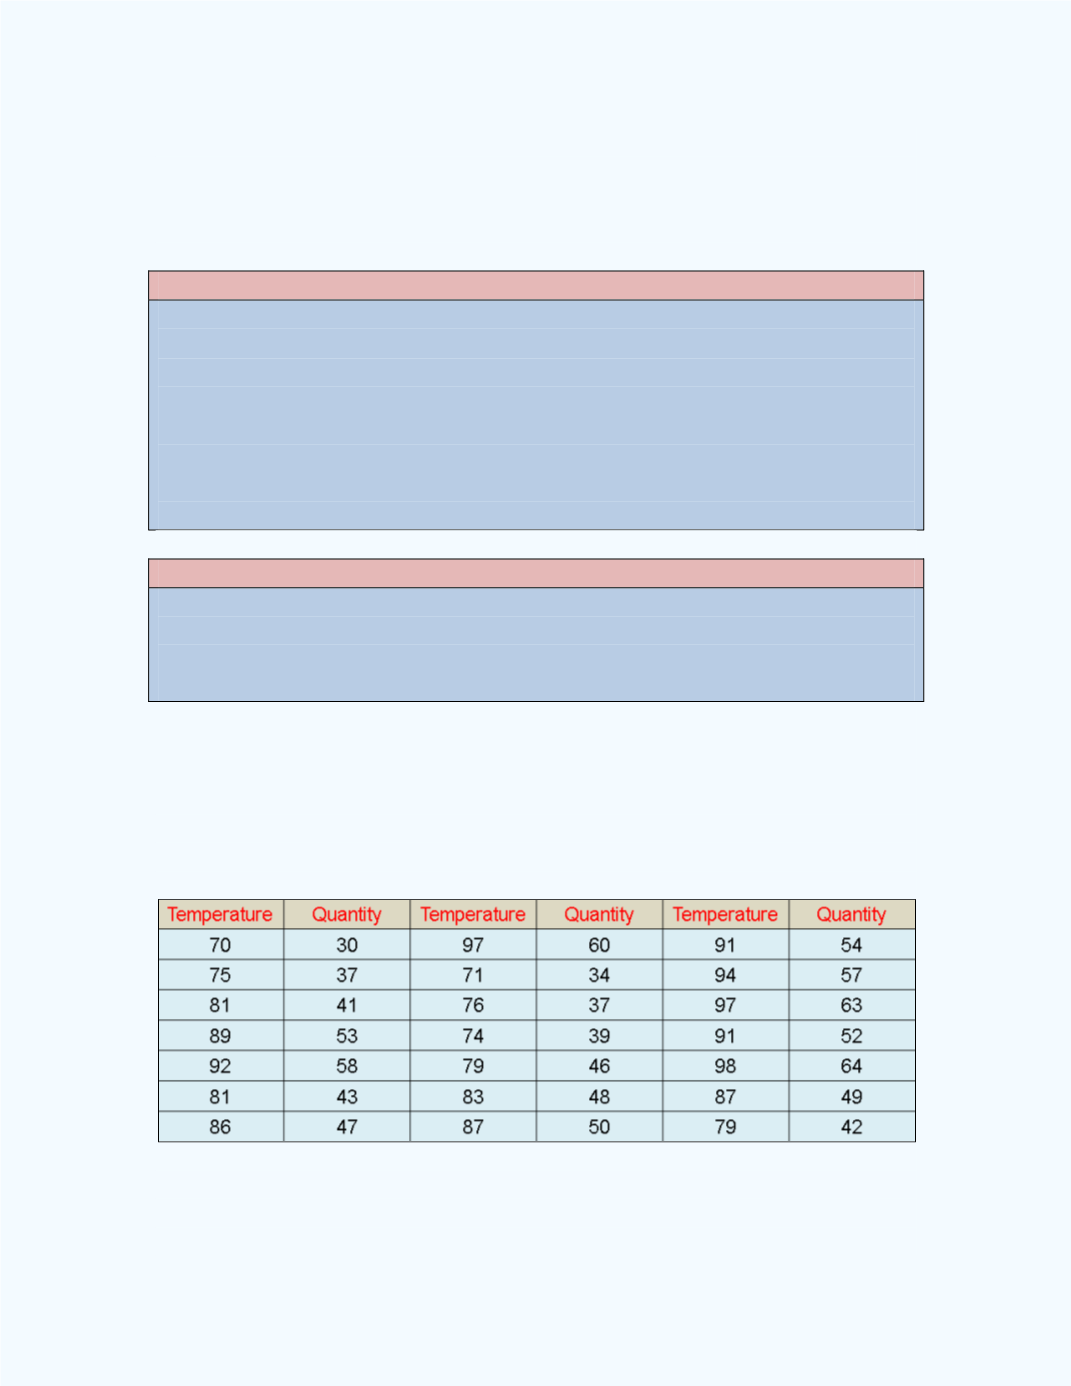
Example 5-6:
The following data relate the high temperature (
0
F) reached
on a given day and the daily number of cans of soft drinks sold from a
particular vending machine in front of a grocery store. Data were collected
for 21 days and is given below. Determine the least squares regression line
for the data.
Solution:
First we need to determine which variable will represent the
independent variable and which will represent the dependent variable. Now,