


 209 / 762

Chapter 5: Bivariate Data
209
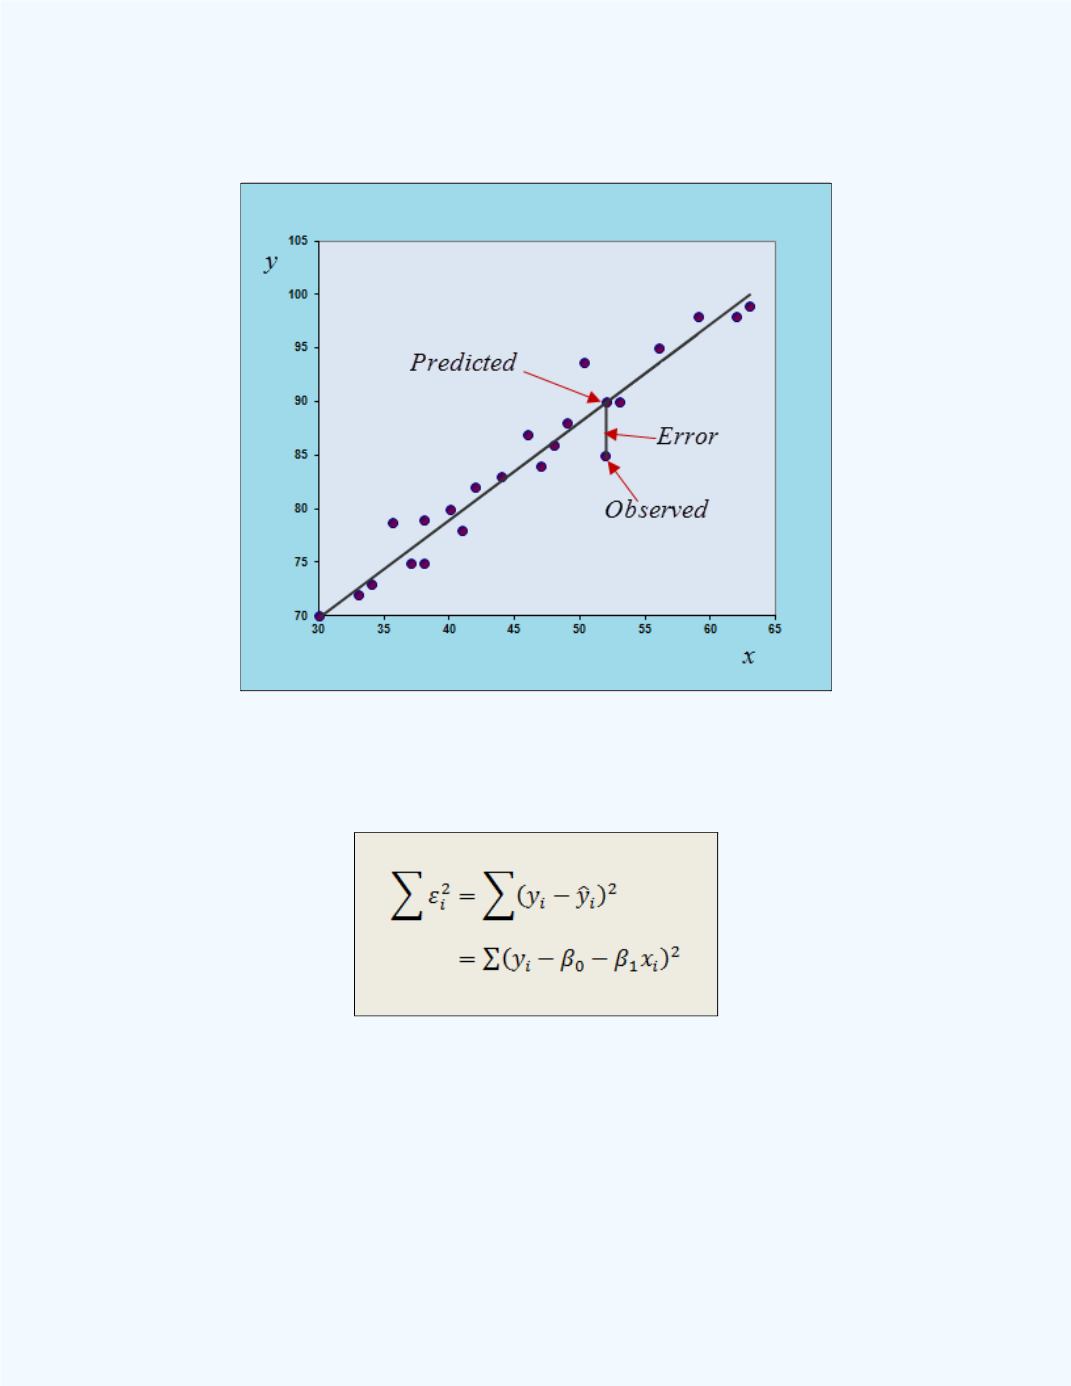
Figure 5-19
shows how an error can occur and how it is measured.
Figure 5-19:
Display of how an error can occur
We can now square these errors and sum them as shown below.
We can use calculus techniques to find estimates for
and
by
minimizing this sum through what we call the
least squares
procedure.
The estimates for
and
are represented by
and
in the regression
equation and are called
Least Squares Estimates
.
The Least Squares regression equation or the Line of Best Fit is shown
below.