


 212 / 762

212
Chapter 5: Bivariate Data
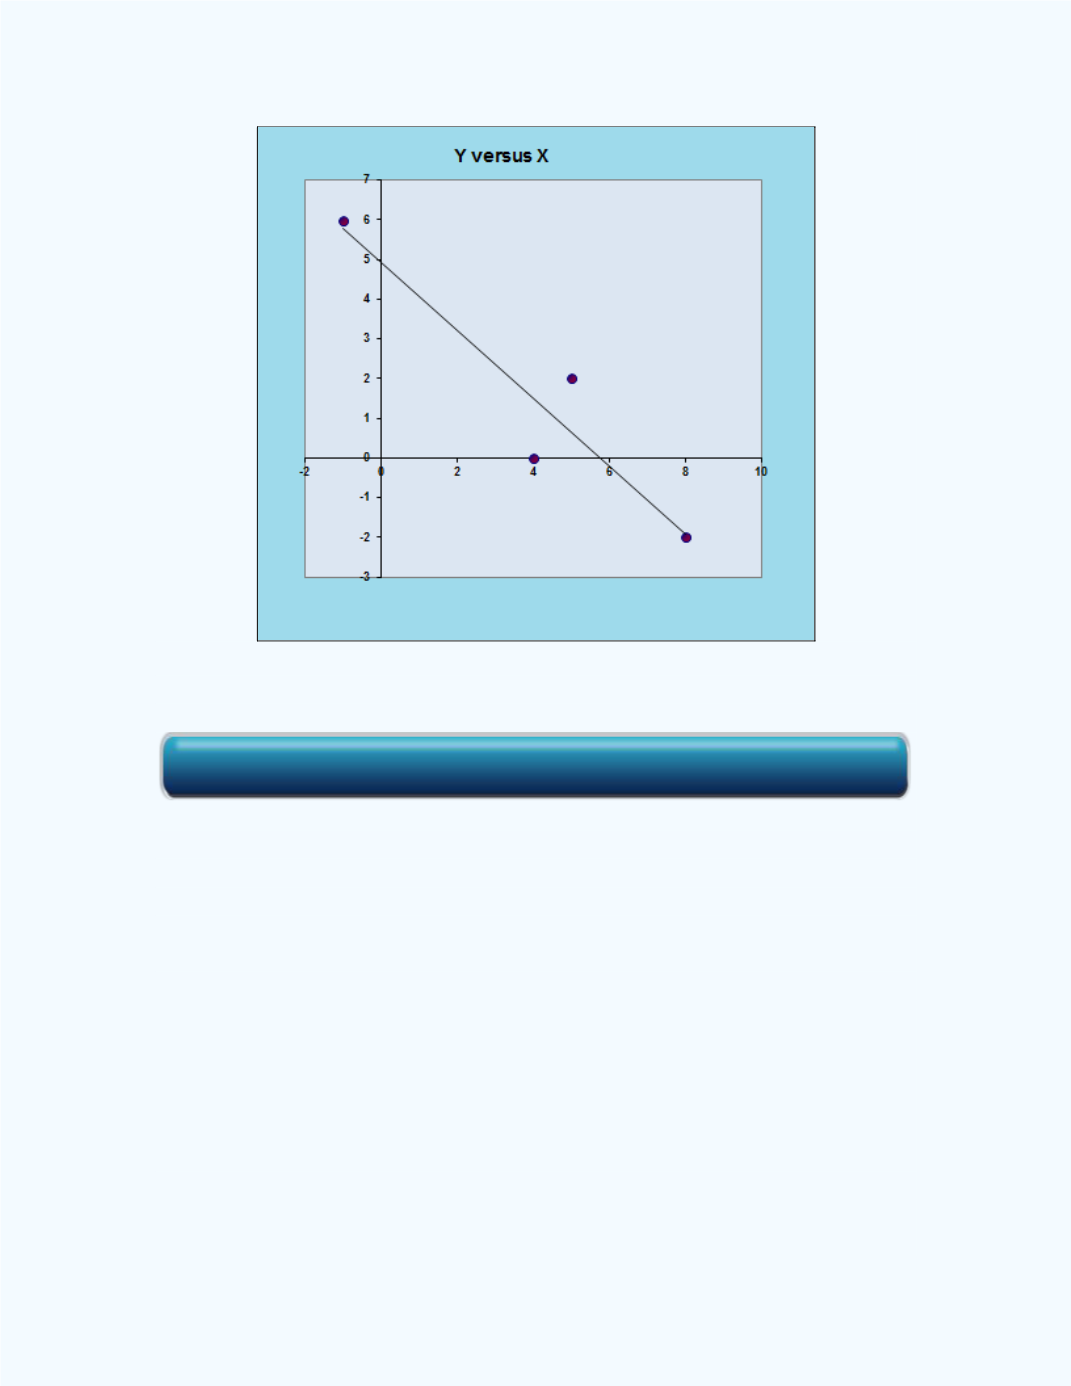
Figure 5-20:
Display of the line of best fit for
Example 5-3
Example 5-4:
Interpret the value of the slope in the regression model for
the data given in
Example 5-3
.
Solution:
Recall that the equation for the line of best fit was
̂
- 0.857
+ 4.929 and so the slope is - 0.857. We can interpret this value
as saying that for 1 unit
increase
in the
(independent variable) value, there
will be a
decrease
(because of the negative value) of 0.857 unit in the
(dependent variable) value.
Example 5-5:
Predict the value of
when
= 4 for the regression model
developed for the data given in
Example 5-3
.
Solution:
All one needs to do is to substitute
= 4 in the equation for the
line of best fit developed and compute. Thus, the predicted value is
Click here for the Simple Regression Workbook