


 219 / 762

Chapter 5: Bivariate Data
219
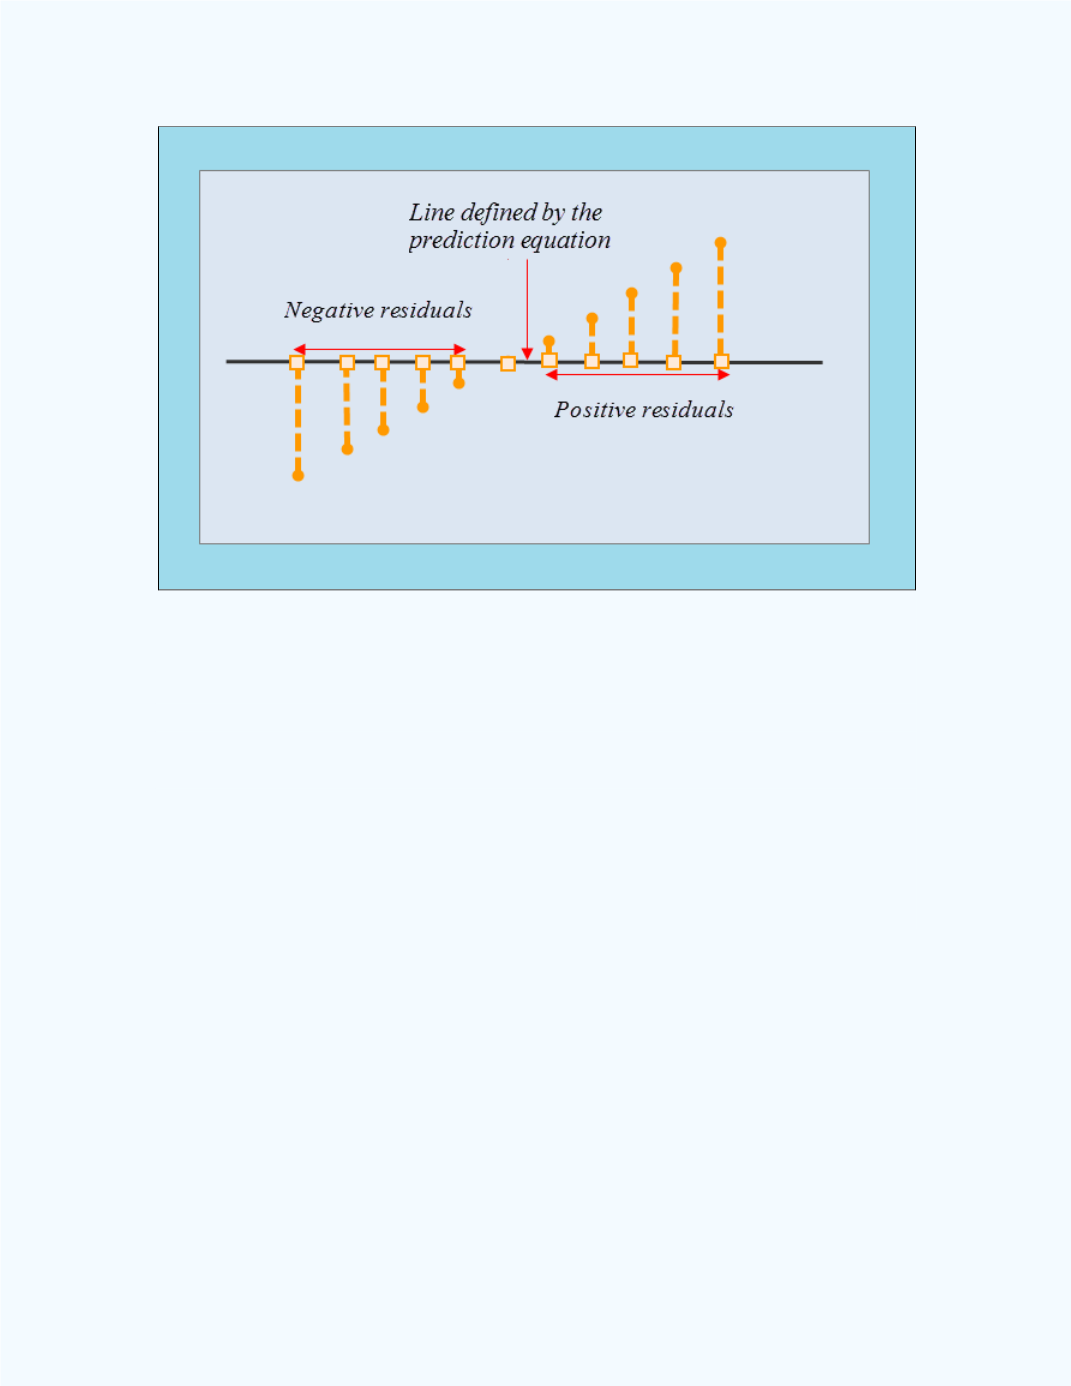
Figure 5-22:
Linear scatter plot
The predicted values are represented by the squares on the horizontal line.
The resulting residuals will be positive and negative as shown on the plot.
When these residuals are plotted against
, a straight line pattern will result.
A linear pattern in the residuals will suggest that a linear model is more
appropriate for the original data.
Figure 5-23
shows the linear pattern of the
residuals.