


 224 / 762

224
Chapter 5: Bivariate Data
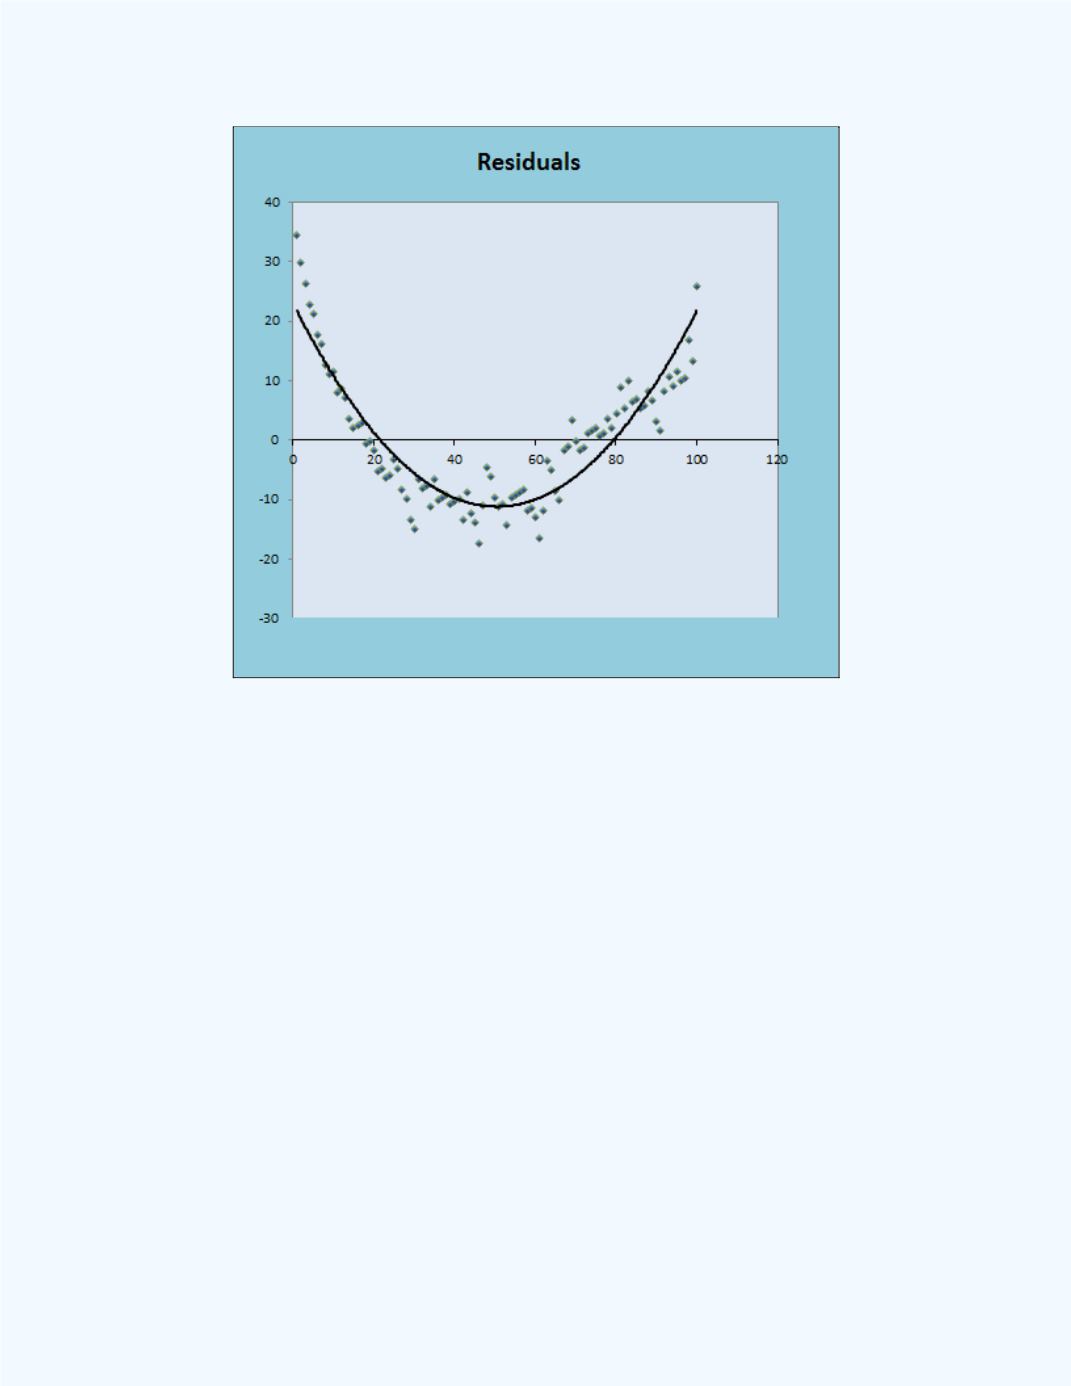
Figure 5-27:
Plot of Residuals versus
Natural Numbers
Thus, we are provided with evidence that a better model may be of second
degree form (contain a term with a power of two). When we try a second
degree model the
R
-squared value is virtually 100% as shown in
Figure 5-28
.