


 226 / 762

226
Chapter 5: Bivariate Data
Illustration 4
:
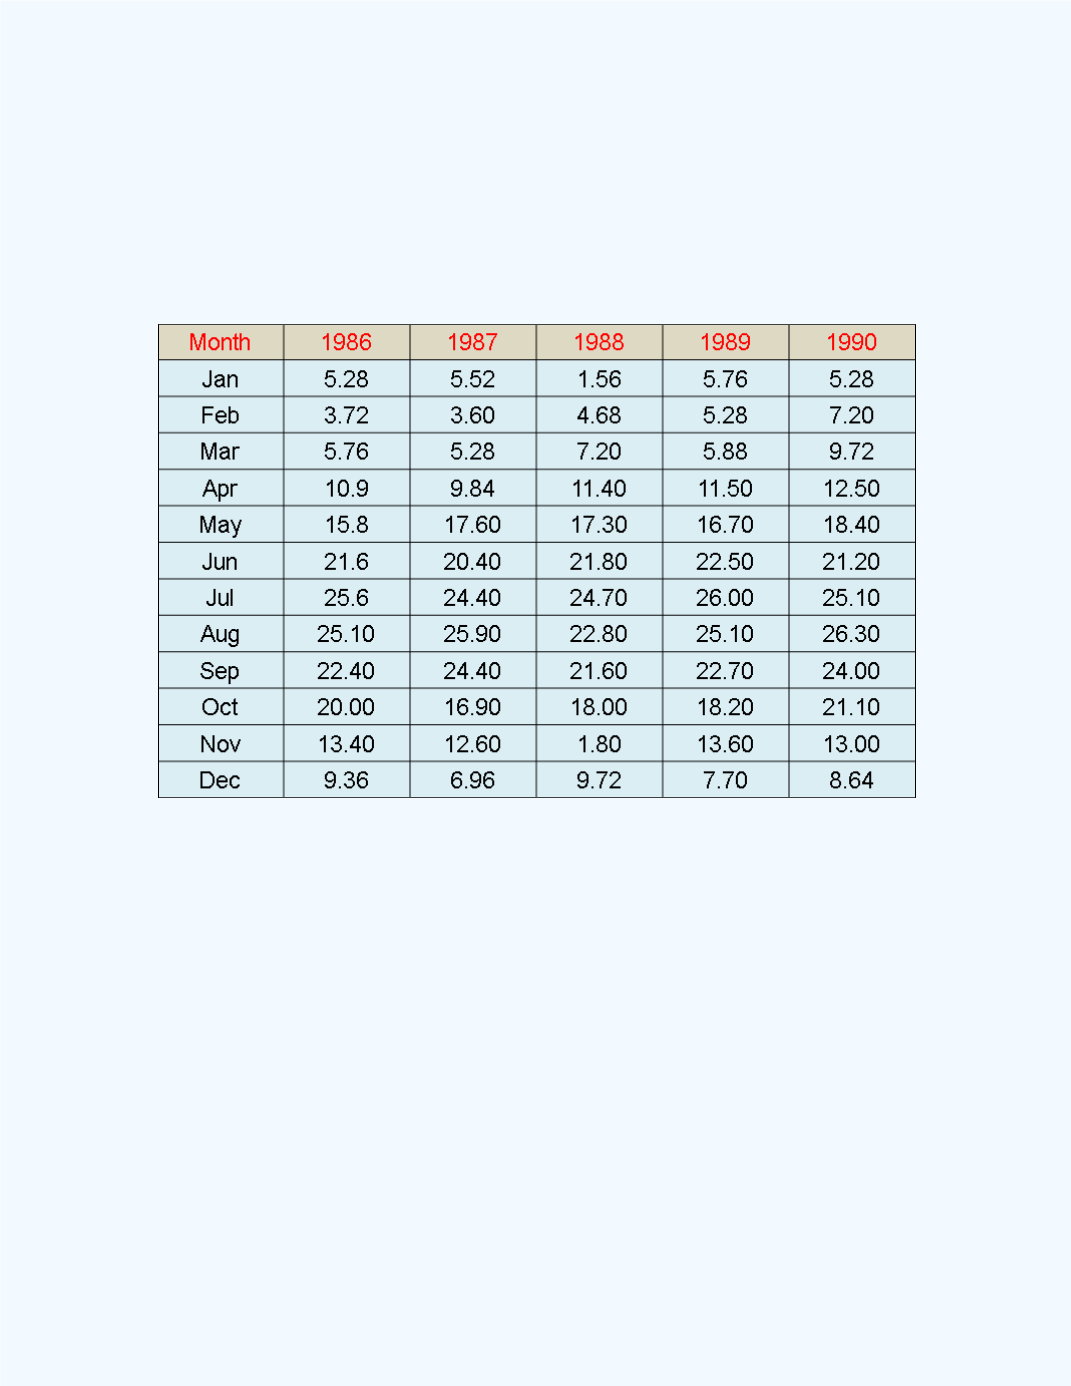
The following table is temperature data for the years 1986-
1990 taken from the middle of the Chesapeake Bay mouth. Use the
Simple
Regression
workbook to analyze the residuals in modeling the data for the
year 1986.
Chesapeake Bay Temperatures in Celsius Degrees
Enter the data for
1986
table above into the workbook as the response y
variable and the months as the predictor x variable. You will have to index
the months as January = 1, February = 2, …, December =12.
Figure 5-29
shows the output with the scatter plot. Observe that the plot displays a very
non-linear pattern.