


 227 / 762

Chapter 5: Bivariate Data
227
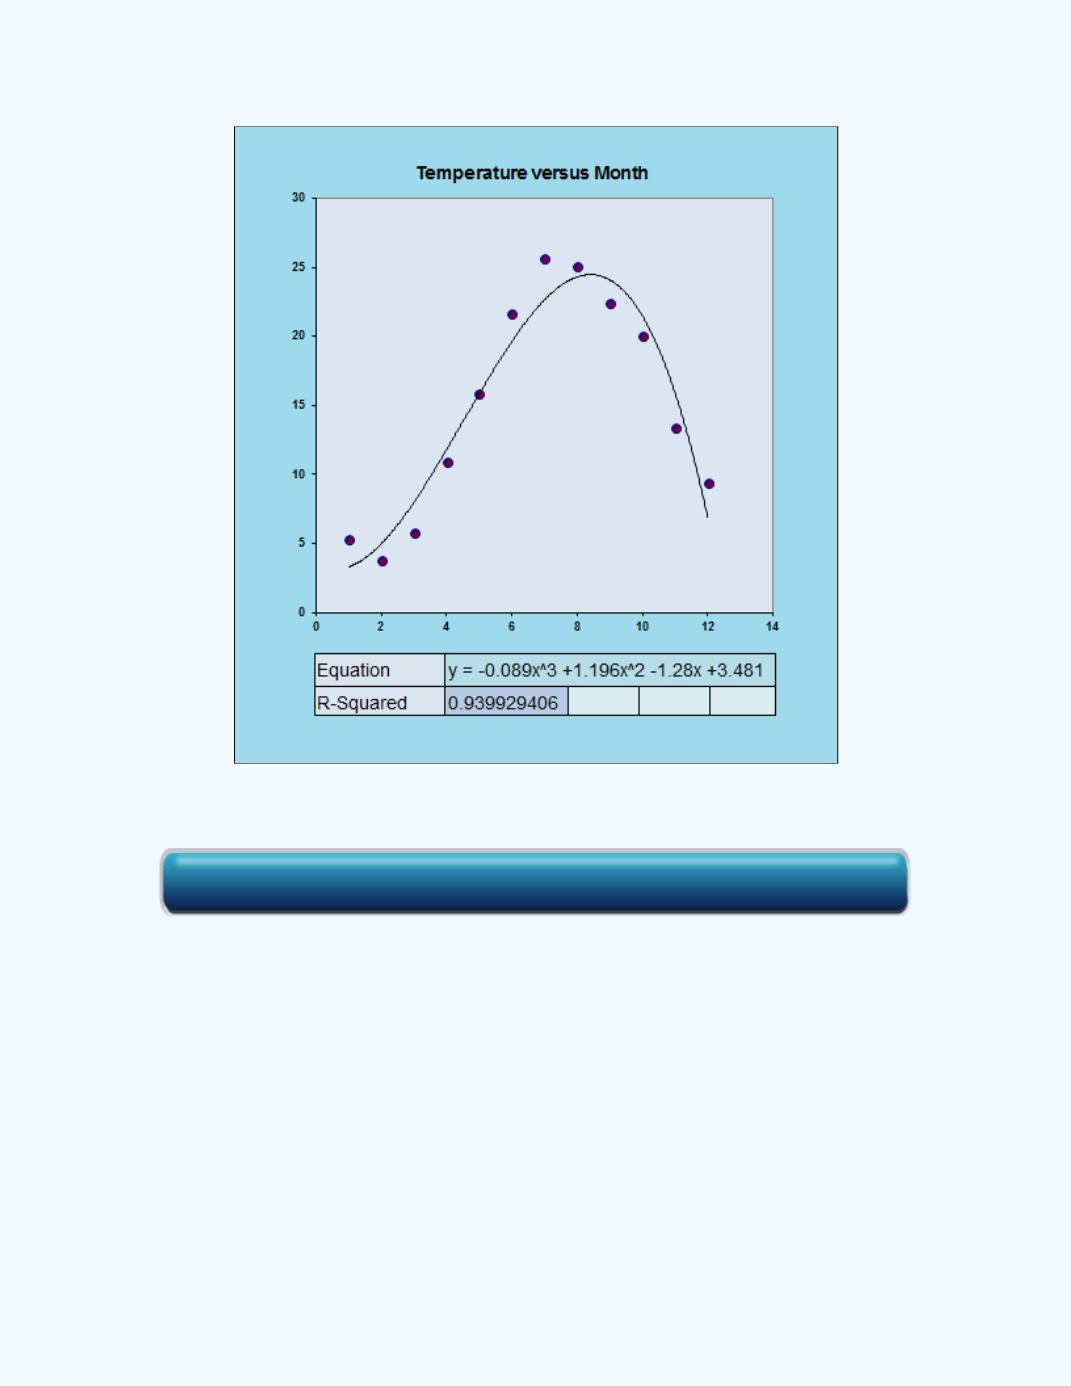
Figure 5-29:
Scatter Plot for the 1986 Data
Figure 5-30
shows a plot of the residuals for the model. Observe that the
plot of residuals appear rather random.
Click here for the Simple Regression Workbook