

 229 / 762

Chapter 5: Bivariate Data
229
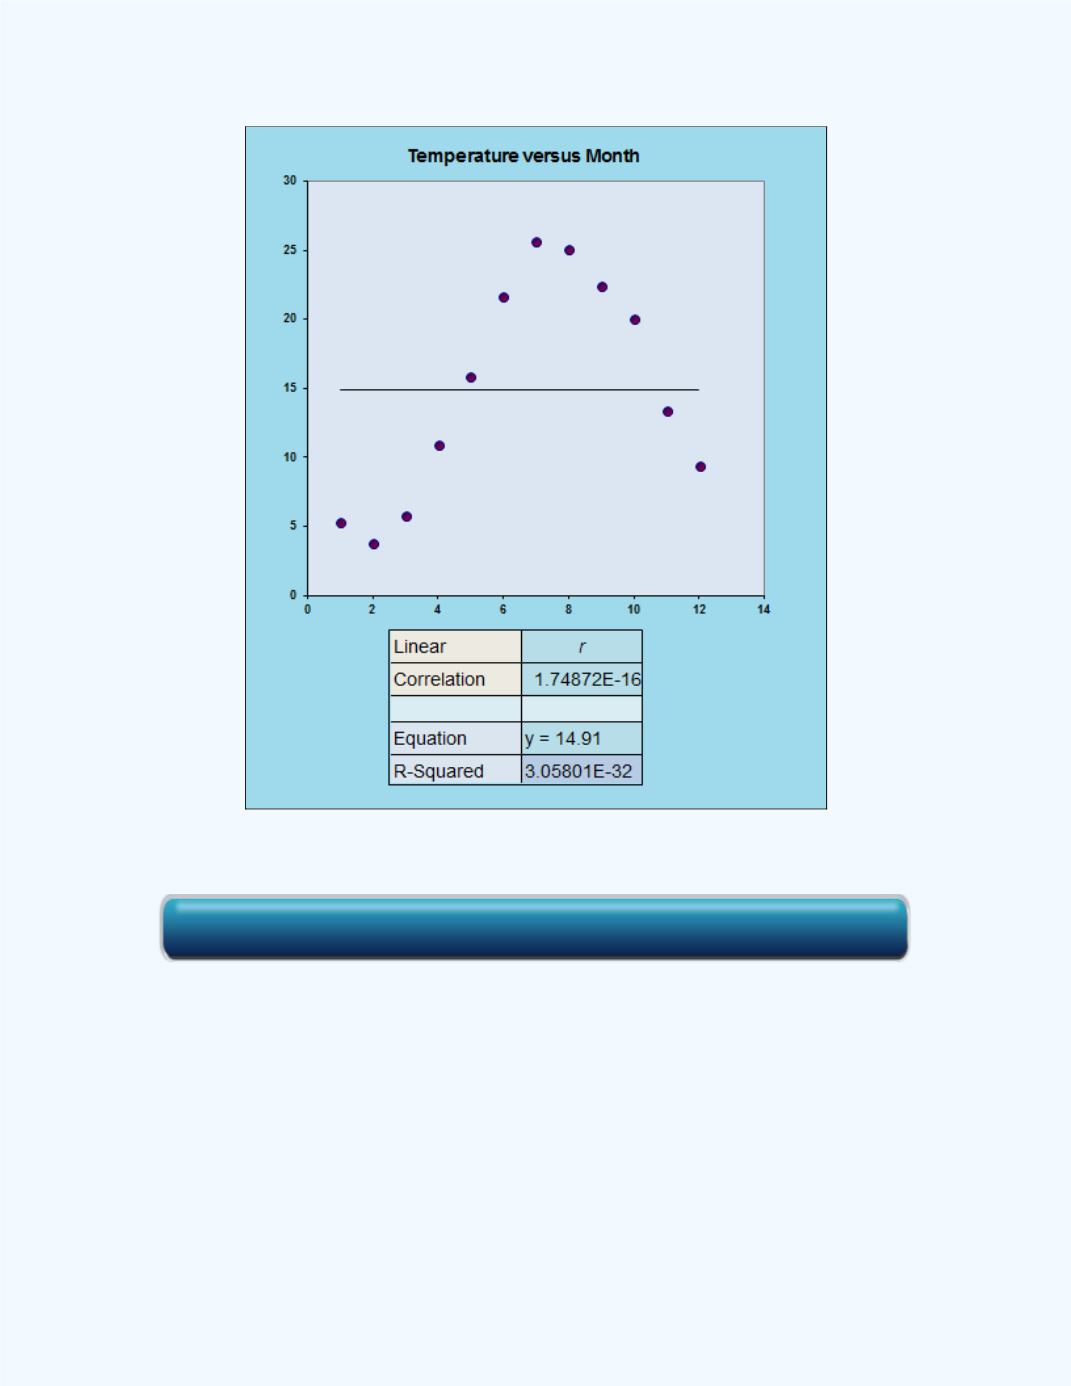
Figure 5-31:
Scatter Plot with a constant model for the 1986 Data
The residual plot for this constant model is shown in
Figure 5-32
.
Click here for the Simple Regression Workbook


 229 / 762


 229 / 762
Chapter 5: Bivariate Data
229
Figure 5-31:
Scatter Plot with a constant model for the 1986 Data
The residual plot for this constant model is shown in
Figure 5-32
.
Click here for the Simple Regression Workbook