

 234 / 762

234
Chapter 5: Bivariate Data
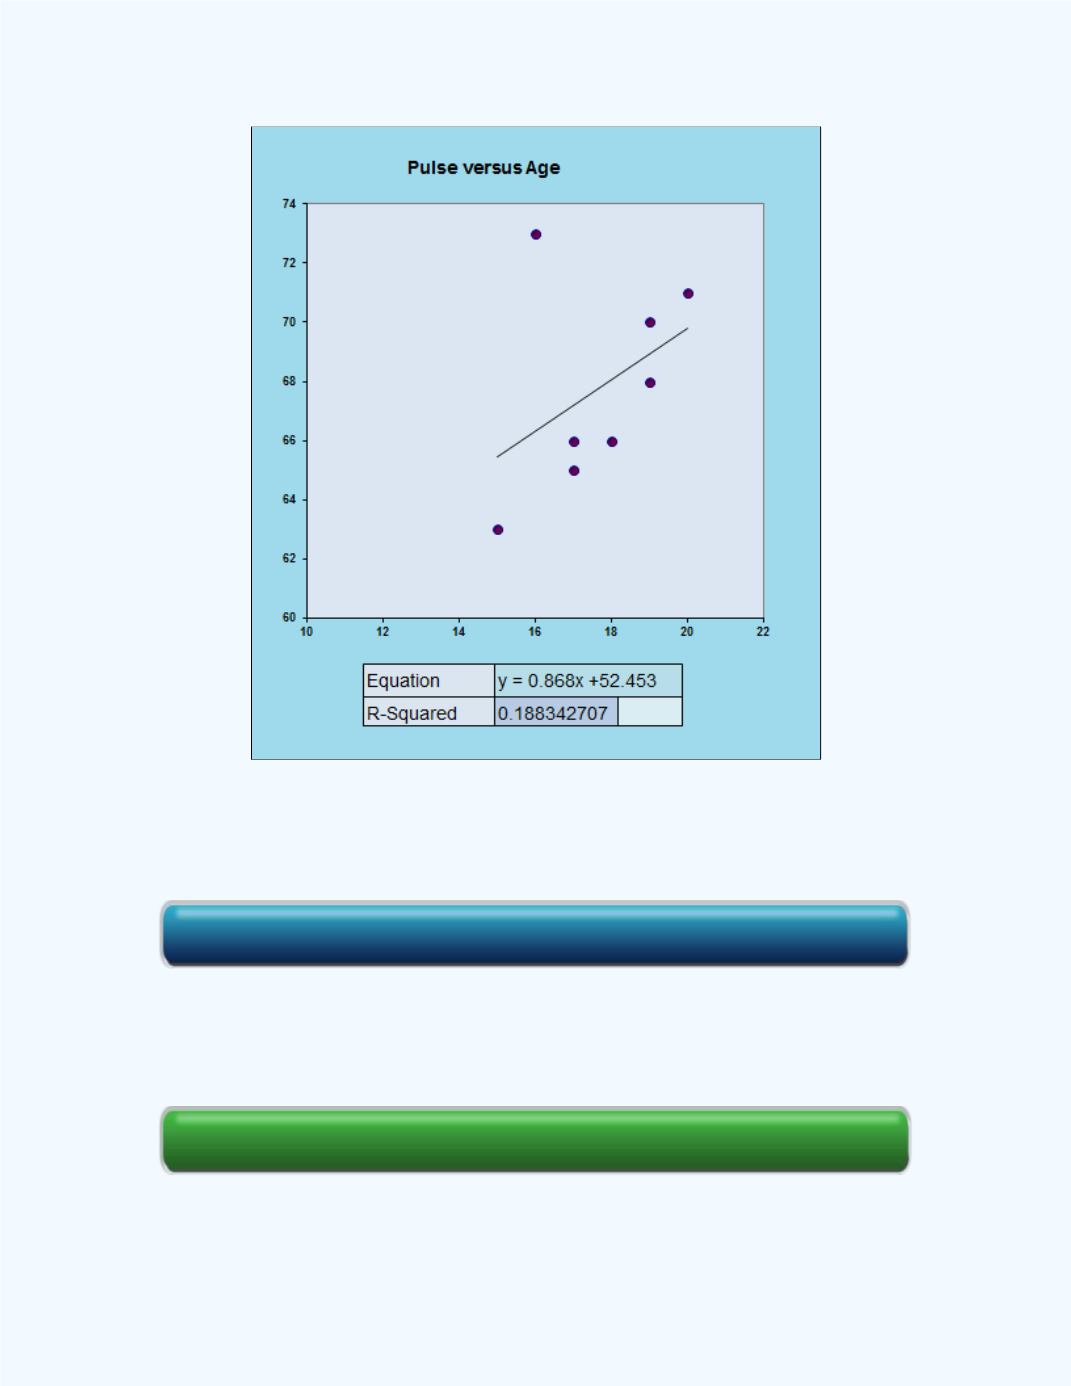
Figure 5-35:
Scatter Plot with Line of Best Fit
when the influential point is
removed
Section Review
e-Self Review Click here for the Simple Regression Workbook


 234 / 762


 234 / 762
234
Chapter 5: Bivariate Data
Figure 5-35:
Scatter Plot with Line of Best Fit
when the influential point is
removed
Section Review
e-Self Review Click here for the Simple Regression Workbook