


 240 / 762

240
Chapter 6: Categorical Data
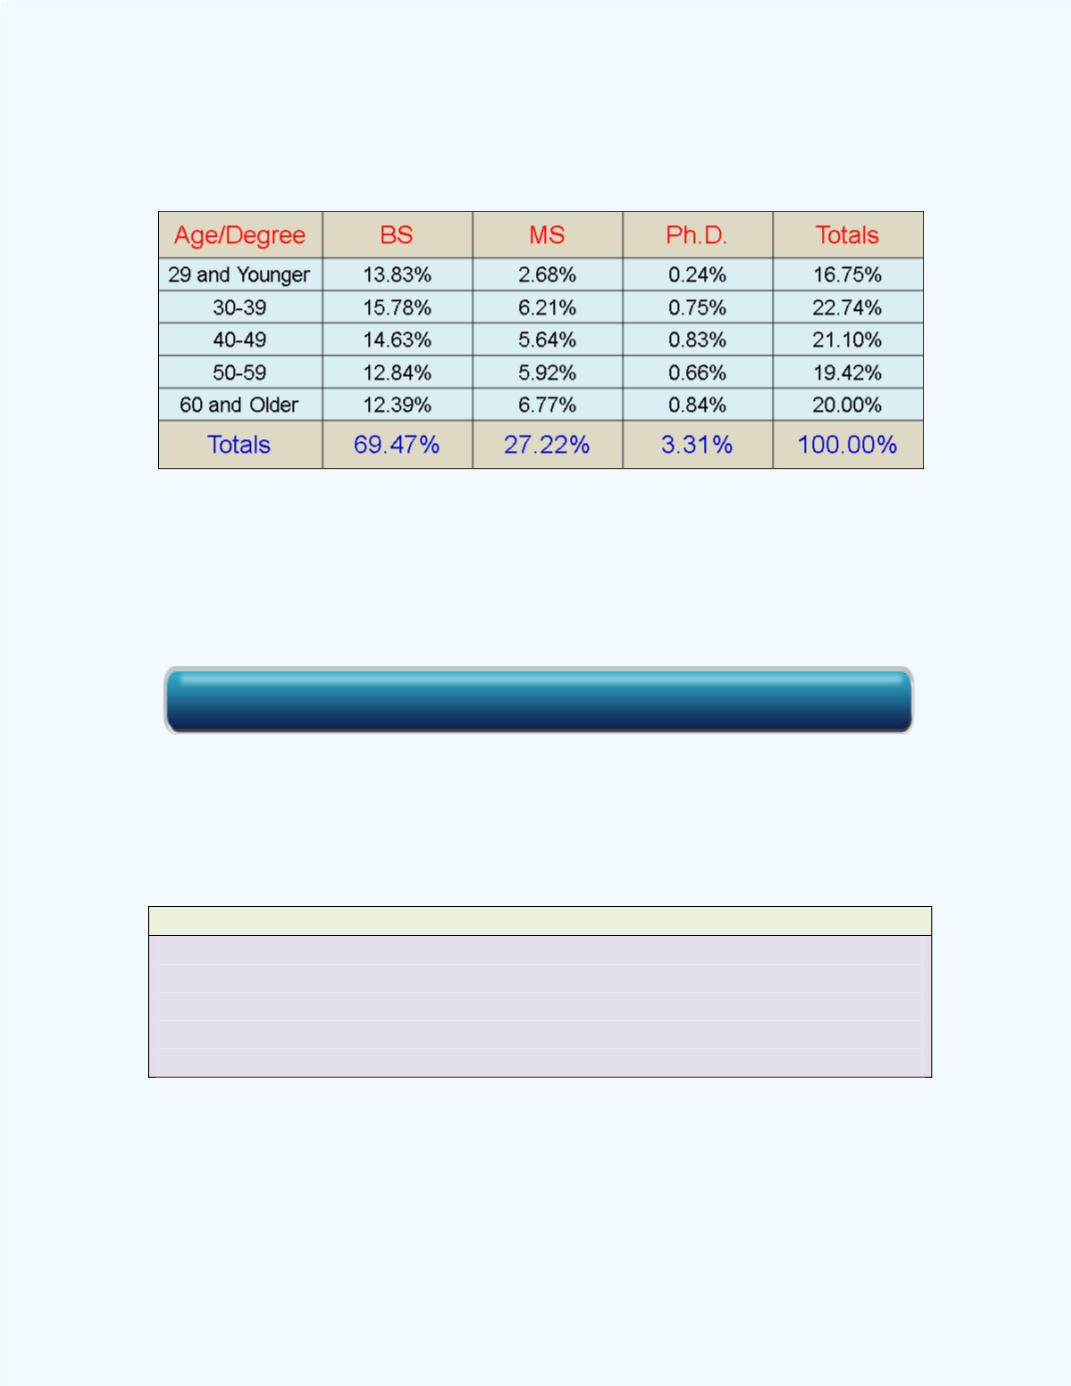
Table 6-2:
Summary of the Joint Distributions for the Number of
Degrees by Age
For instance in
Table 6-2
, the value of 13.83% is obtained by dividing the
frequency value of 4,286 by the grand total 30,987 from
Table 6-1
and
expressing the result as a percentage. Similarly, we divide each frequency
value in the table by the grand total, expressed as a percentage, to get the
values in
Table 6-2
.
Marginal Distributions
Before we start to compute values for the marginal distributions we will first
define what we mean by marginal distributions.
Definition: Marginal Distribution
A marginal distribution for a variable is the percentage of that variable
expressed as a row or column total relative to the grand total for the cross
tabulated table.
(b)
Compute the marginal distributions for the degree variable.
Click here for the Contingency Table Workbook