


 246 / 762

246
Chapter 6: Categorical Data
conditional distributions for the rows given the columns. The column
conditional distributions are given in
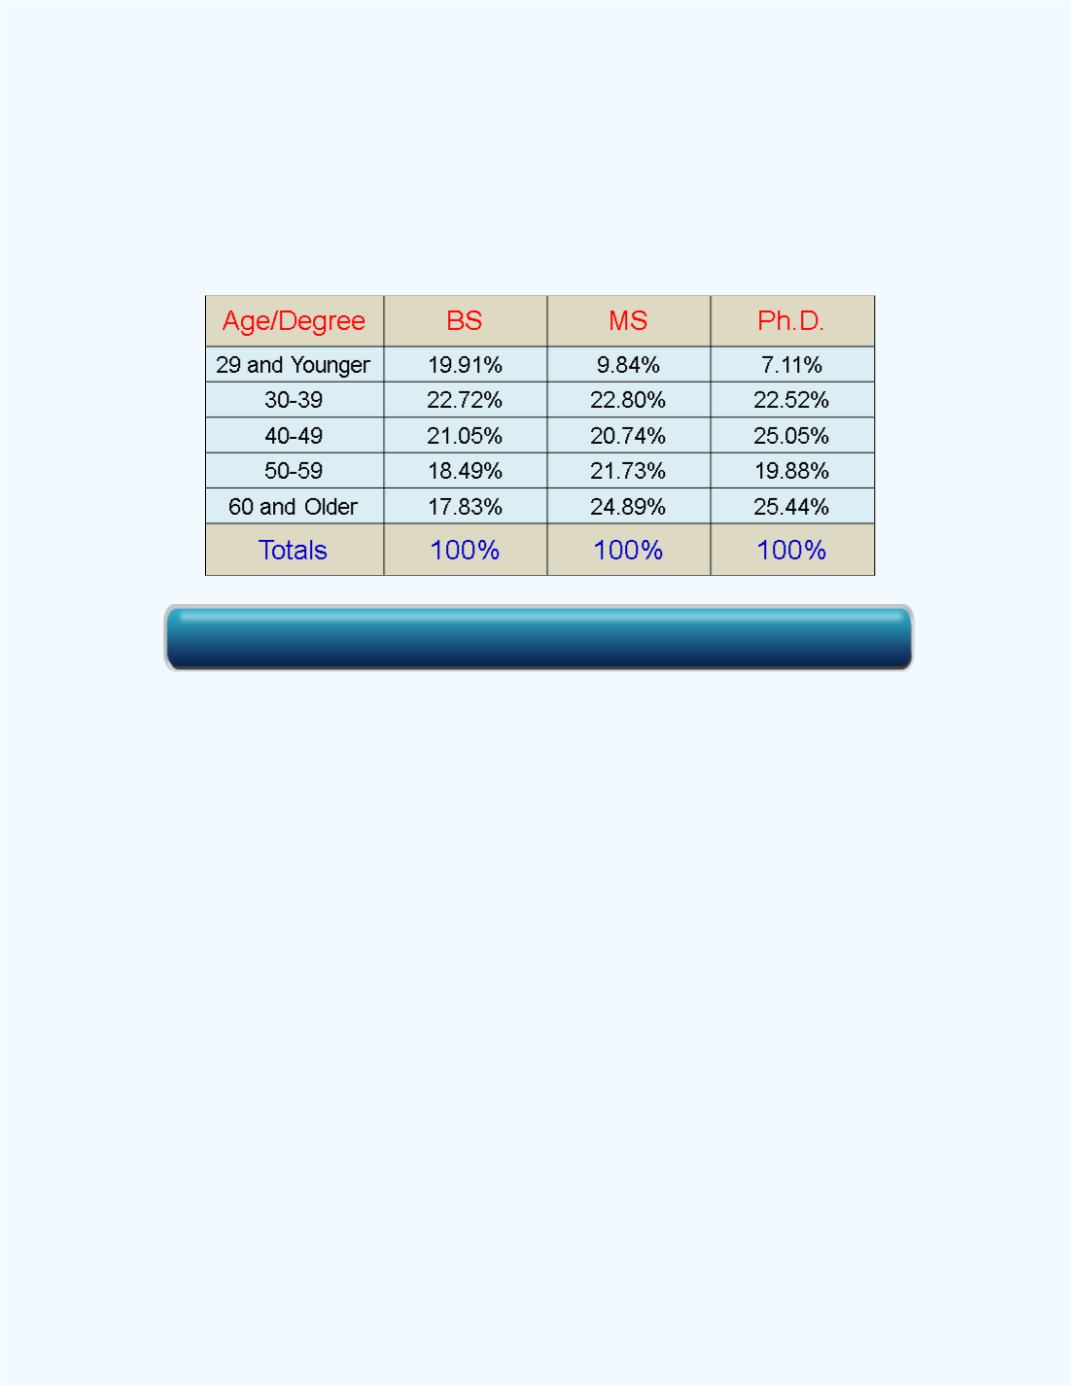
Table 6-5
.
Table 6-5:
Conditional Distributions for Age Given
Degree
Question:
How do you interpret the values for the conditional
distributions given in
Table 6-5
?
We will explain with an illustration in the following example.
Example 6-3:
Interpret the value of 20.74% in
Table 6-5
.
Solution:
The value of 20.74% indicates that 20.74% of the females with a
MS degree are between 40 and 49 years of age for the reported data.
We can use the
Contingency Table
workbook to compute these column
conditional distributions as shown in
Figure 6-3
.
Click here for the Contingency Table Workbook