


 250 / 762

250
Chapter 6: Categorical Data
Solution:
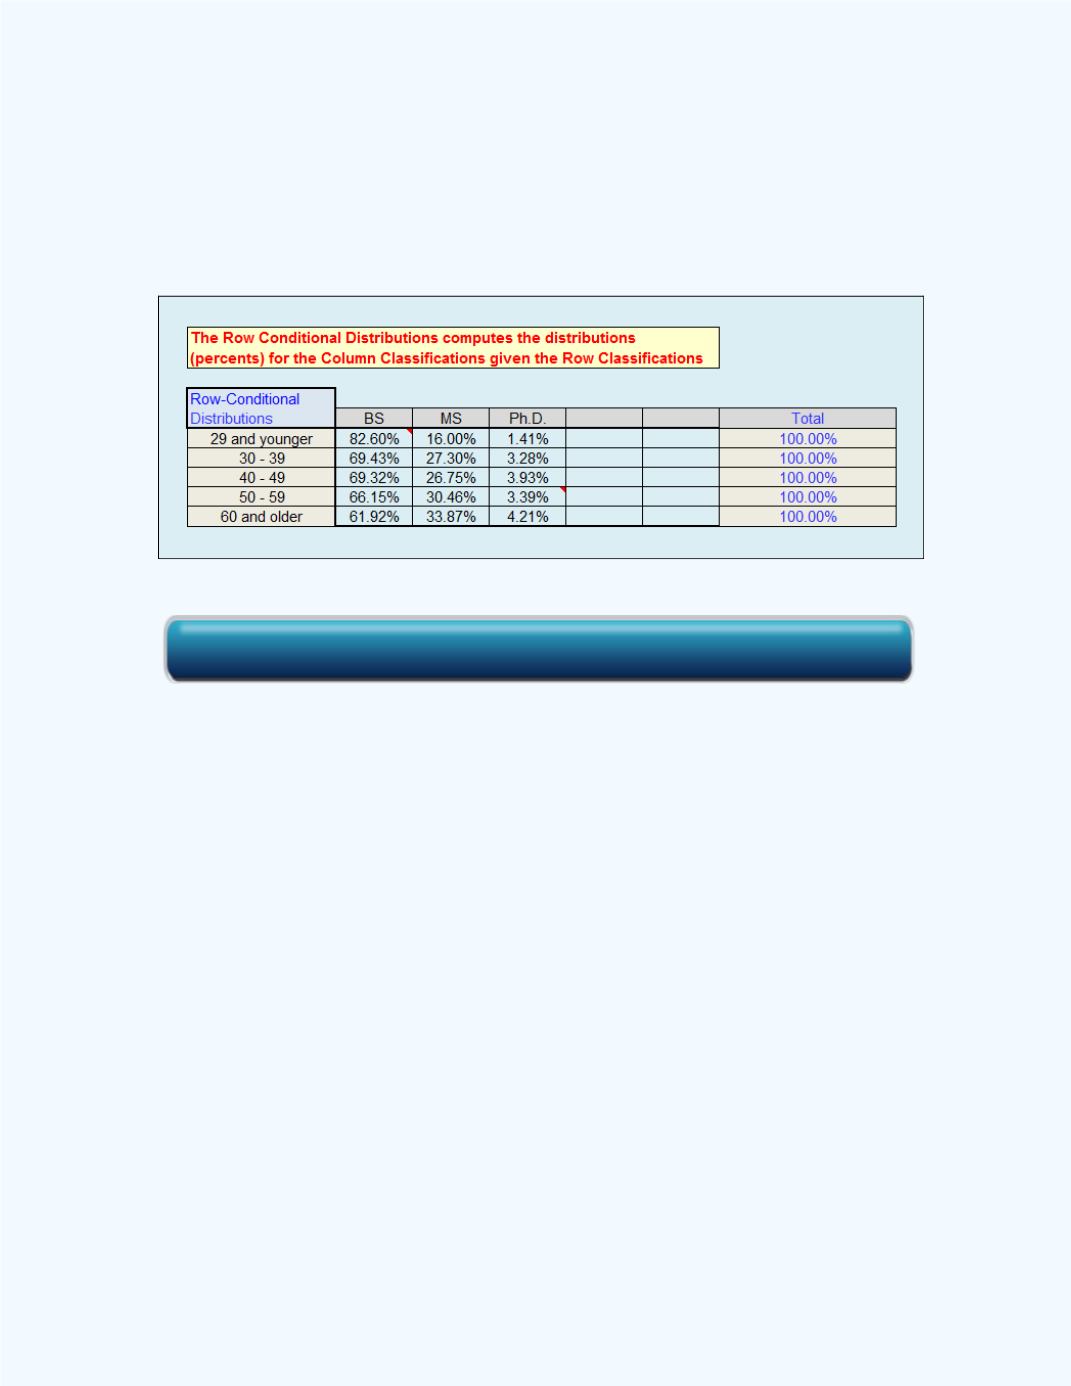
The value of 27.30% indicates that 27.30% of the females with
ages between 30 and 39 have MS degrees for the reported data.
We can use the
Contingency Table
workbook to compute these row
conditional distributions as shown in
Figure 6-5
.
Figure 6-5:
Conditional Distributions for Degree Given Age
The
Contingency Table
workbook automatically generates a bar graph to
display these row conditional distributions. The conditional distributions for
the degree classification given the age classification for
Table 6-6
are
graphically displayed in
Figure 6-6
.
Click here for the Contingency Table Workbook