


 256 / 762

256
Chapter 6: Categorical Data
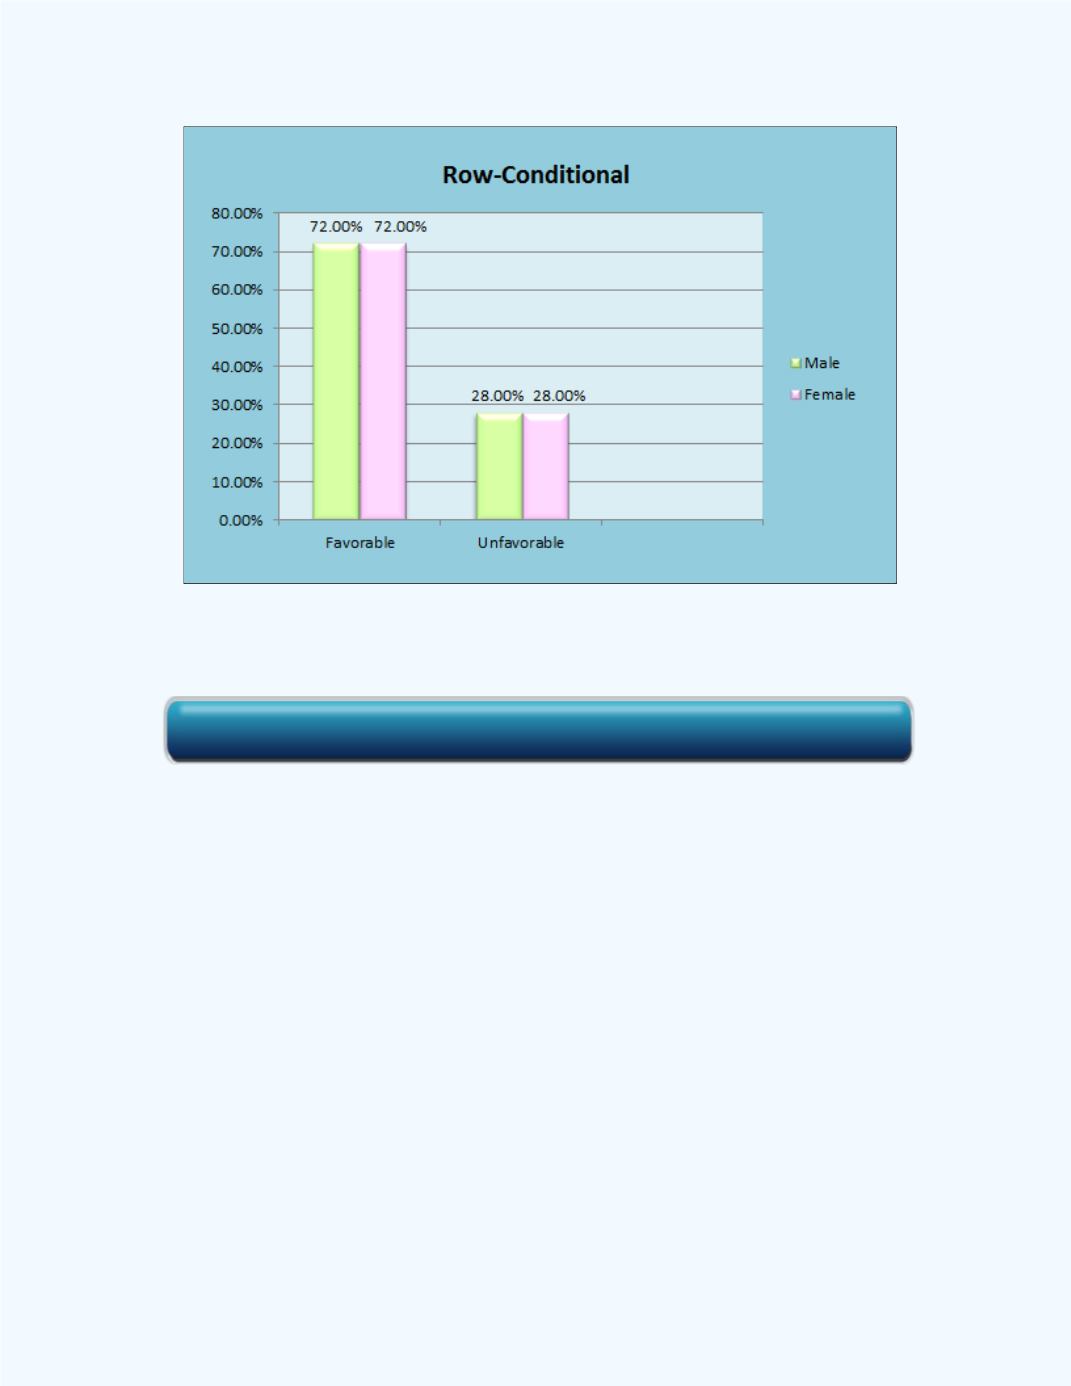
Figure 6-10:
Bar Graph displaying Conditional Distributions for
Ratings Given Gender for
Example 6-8(b)
(c) Based on the results in parts (a) and (b), can one conclude that the gender
variable and the favorable/unfavorable ratings variable are independent?
That is, is there no association between the male and female responses of
favorable or unfavorable?
Solution:
(c) From part (a), the distributions of gender of the student were
conditioned on the ratings. From the computed conditional distributions for
gender, we see that the values are the same for the male classification for
both the favorable and unfavorable classifications. Also, for the female
classification, the conditional distributions are the same. Based on the
definition of independence for contingency tables, one will conclude that
there is no association between the gender of the students and their responses
of favorable or unfavorable. That is, these variables are independent of each
other.
Click here for the Contingency Table Workbook