


 258 / 762

258
Chapter 6: Categorical Data
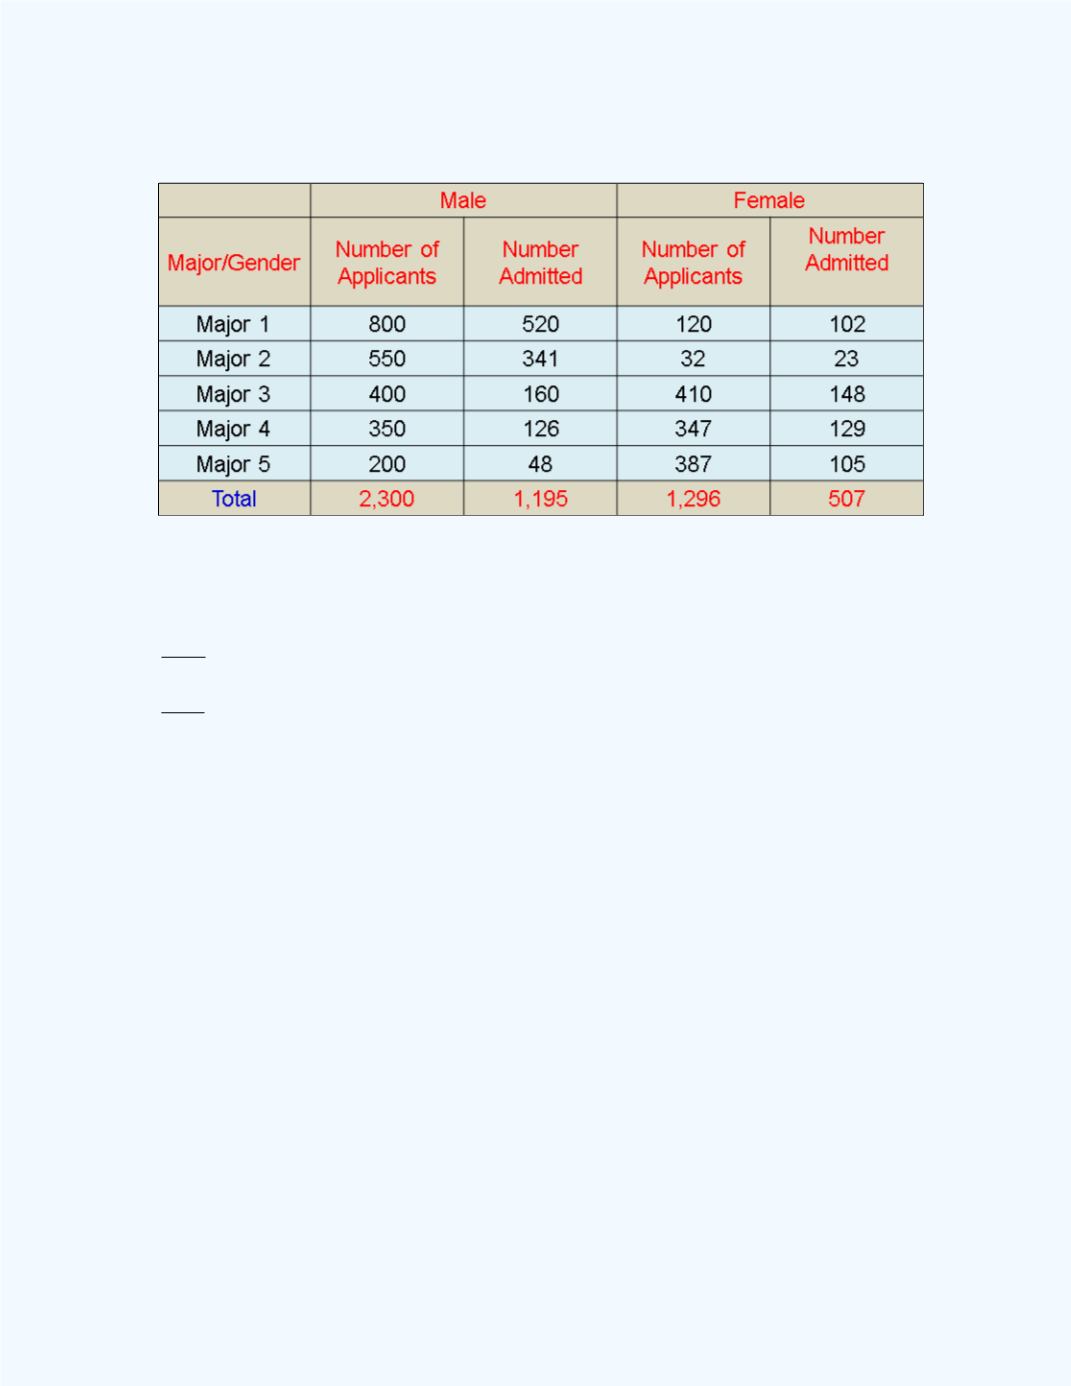
Table 6-10:
Admissions by Gender and Major
There were actually a total of 8,442 males and 4,321 females who had
applied for admission. Out of the males that applied, 3,714 were accepted
and, out of the females, 1,512 were accepted. That is,
%44 %99.43 %100
8442
3714
of the males were accepted, and
%35 %99.34 %100
4321
1512
of the females were accepted. These percentages
would suggest that there may be discrimination against females in admission
to the graduate school. However, if this was so, then the discrimination
should also be apparent in the admission rates for the different majors, since
admission was by department.
Let us consider the percentages that were admitted for both males and
females.
Table 6-11
displays these data.