


 260 / 762

260
Chapter 6: Categorical Data
Table 6-12:
Marginal Distributions for Gender
From this distribution, one should be alarmed. Here, 70% of the persons
admitted to these five majors are males and only 30% are females.
Table 6-13
shows the marginal distributions for major.
Table 6-13:
Marginal Distributions for Majors
We can observe that
major 1
had the highest admission rate for all five
majors.
Next, we display the conditional distributions for the
gender
of the applicant
given the
major
chosen. These distributions are given in
Table 6-14
.
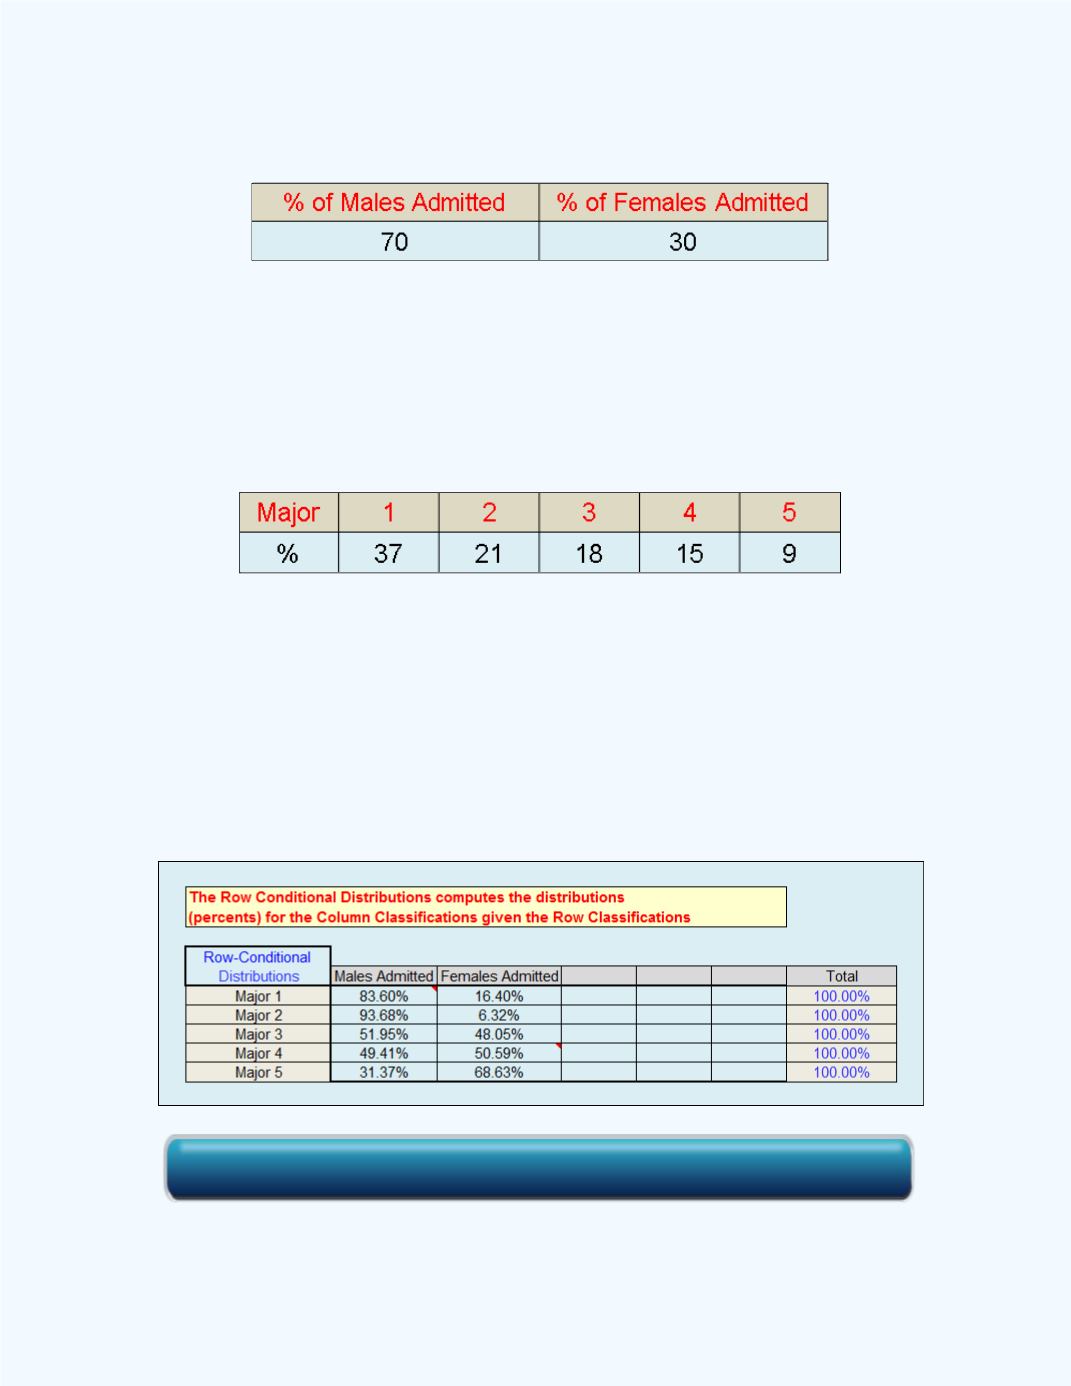
Table 6-14:
Conditional distributions for Gender
given Major
Click here for the Contingency Table Workbook