


 262 / 762

262
Chapter 6: Categorical Data
The next table,
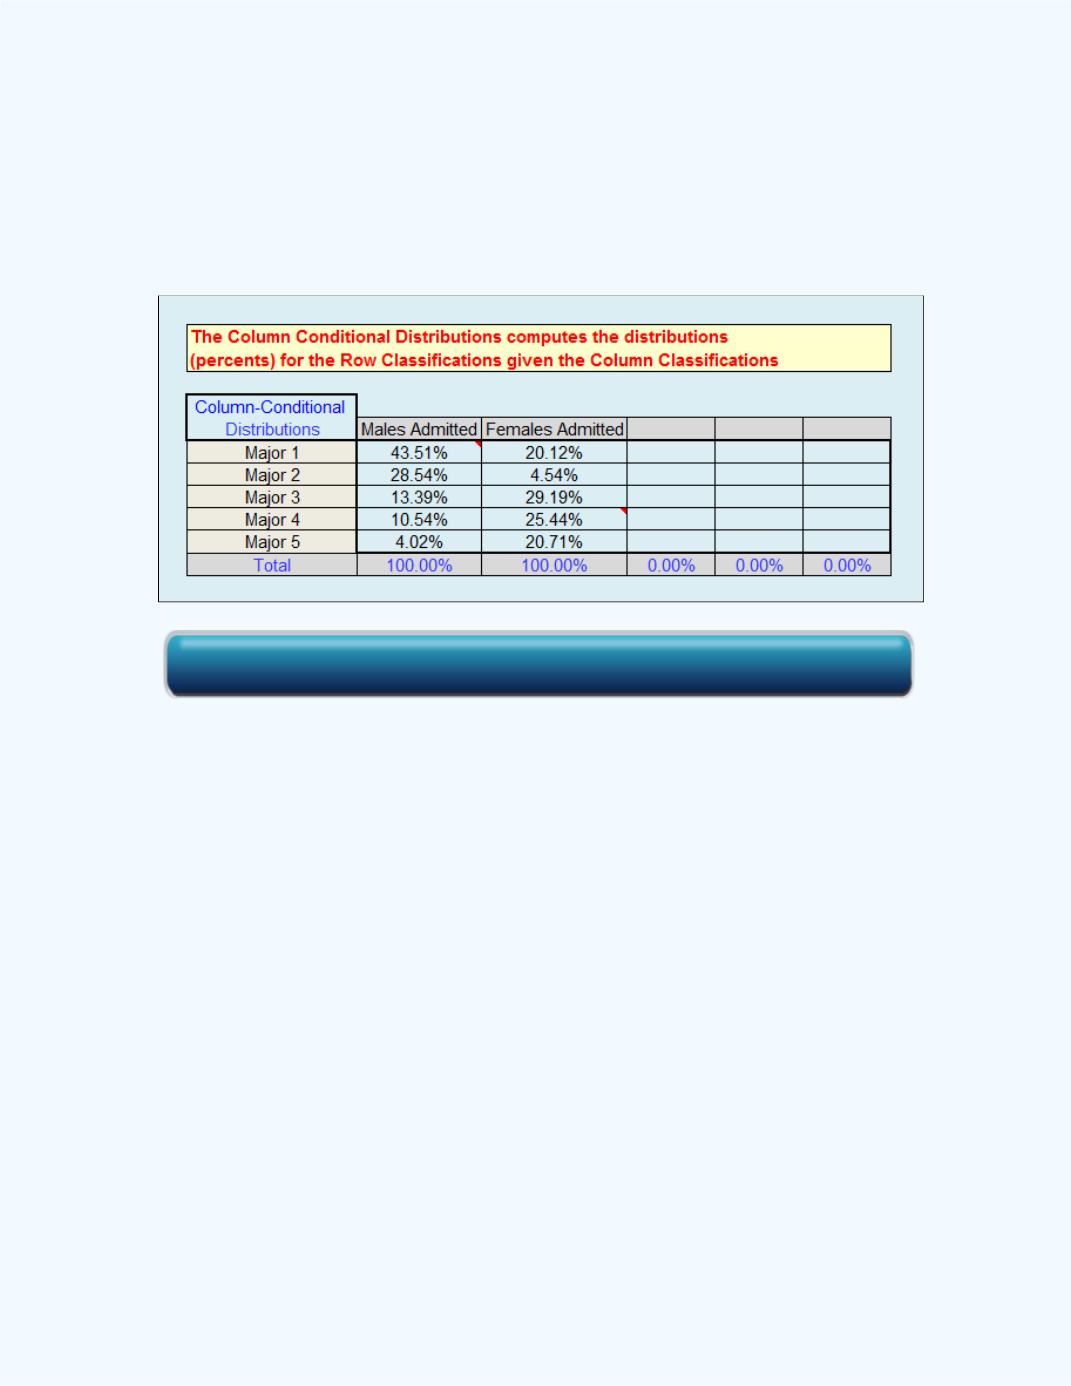
Table 6-15
, shows the conditional distributions for the
majors
given the
gender
of the applicant.
Table 6-15:
Conditional Distributions for Majors
given Gender
From these conditional distributions for
major
given the
gender
of the
applicants, one can observe that for the males, the percentage decreases from
major to major whereas it stayed relatively the same for the female applicants
except for major 2. For the male applicants, more are accepted in major 1
and major 2, while more females than males are accepted in the other majors.
Again, one can make counterarguments for bias. Here again, the variable of
major
was
confounding
the
gender
variable in the computation of the 70%
of males being accepted compared to the 30% of females.
Figure 6-12
shows the bar graph displaying these conditional distributions for
Table 6-15
. From the graph of the conditional distributions for major given
the gender, one can observe again that for the different majors, the
percentages for the males and females are generally going in opposite
directions.
Click here for the Contingency Table Workbook