


 261 / 762

Chapter 6: Categorical Data
261
From these conditional distributions for gender given the major, one can
observe again that for the different majors, the percentages for the males and
females are generally going in opposite directions. That is, for majors 1, 2,
and 3, there are more males than females and for majors 4 and 5, there are
more females than males. One can make the argument that based on majors
1, 2, and 3 there is gender bias against females. However, one could also
argue that there is not a male bias based on the conditional distributions for
majors 4 and 5. Again, the variable of
major
was
confounding
the
gender
variable.
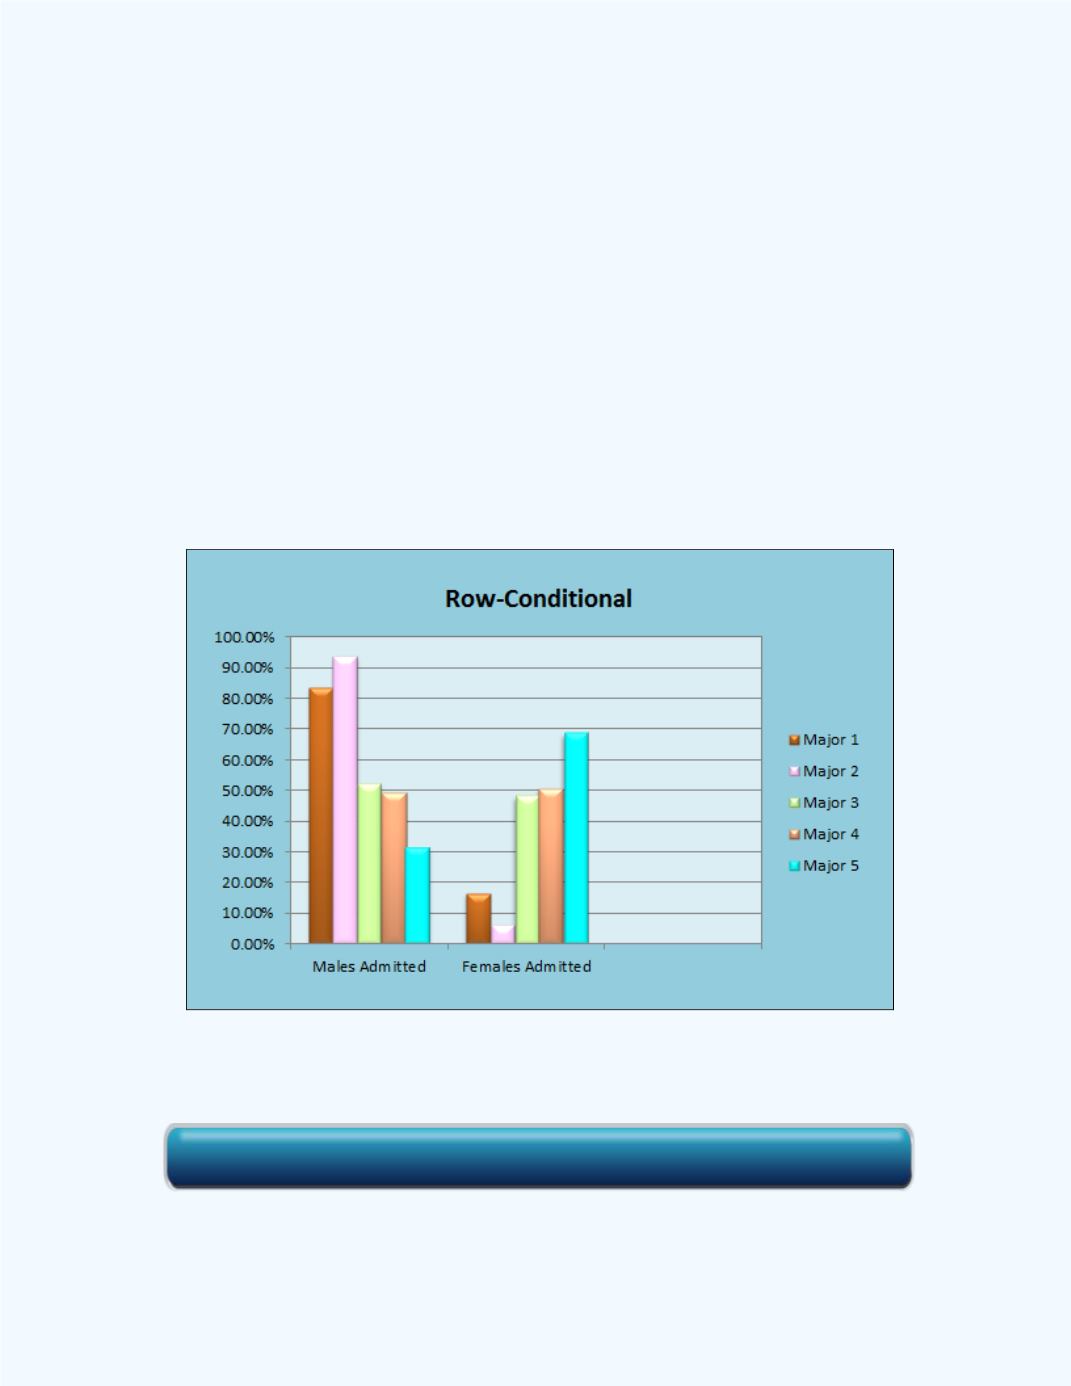
Figure 6-11
shows the bar graph displaying these conditional distributions for
Table 6-14
. From the graph of the conditional distributions for gender given
the major, one can observe again that for the different majors, the percentages
for the males and females are generally going in opposite directions.
Figure 6-11:
Bar Graph displaying Conditional Distributions for
Gender Admitted Given the Major
Click here for the Contingency Table Workbook