


 259 / 762

Chapter 6: Categorical Data
259
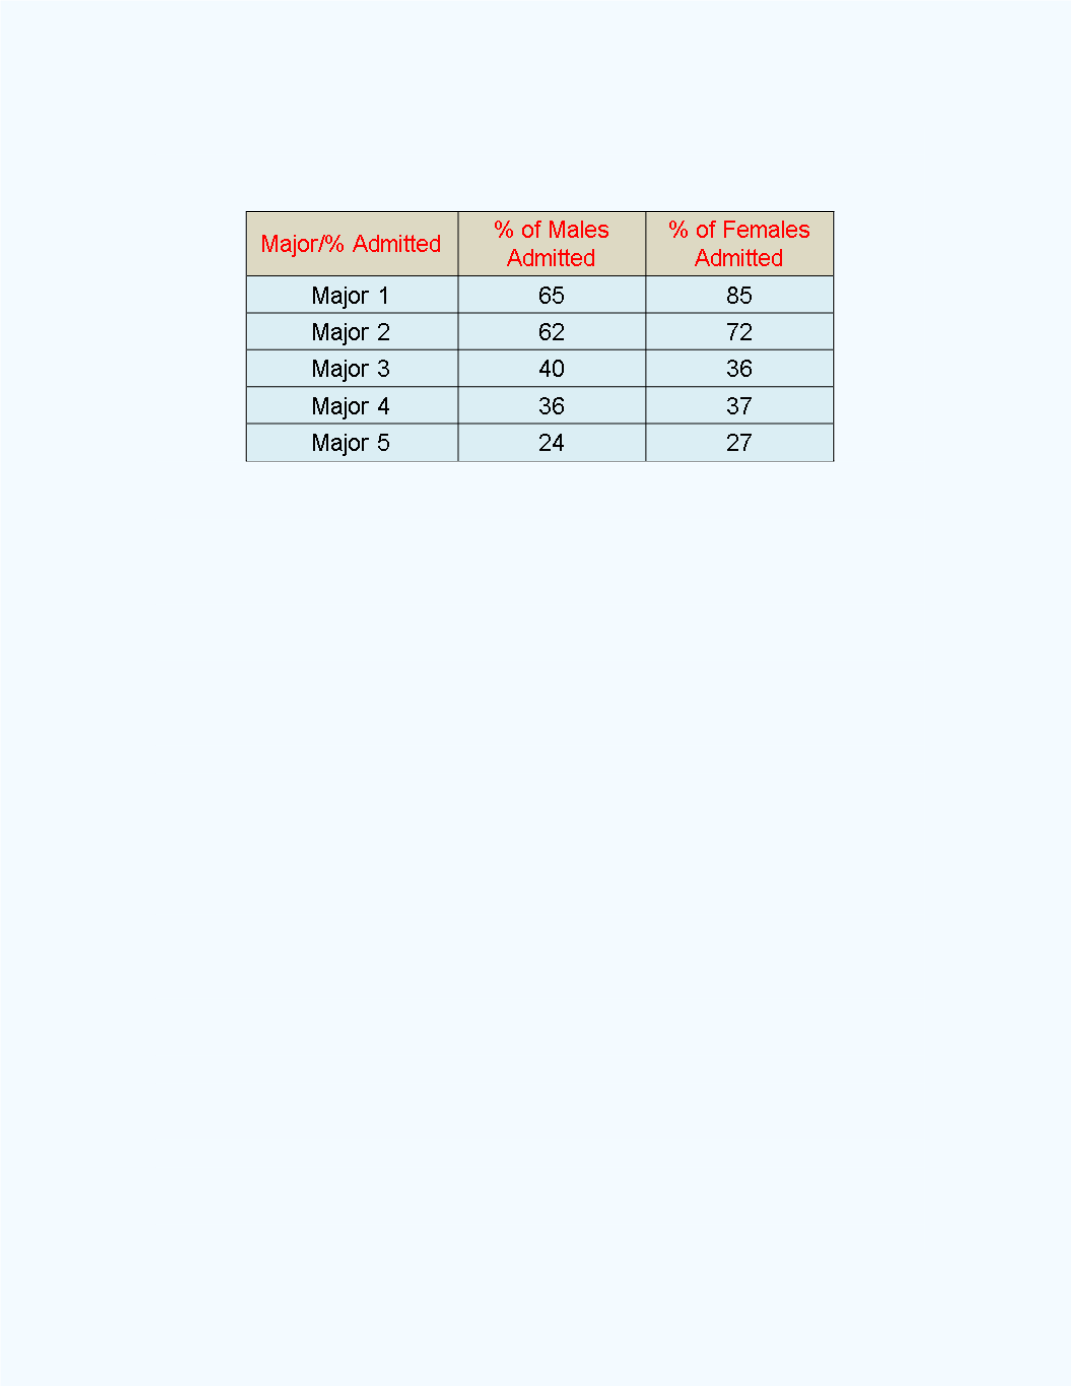
Table 6-11:
Percentages of Males and Females
Admitted
Note:
These values were approximated to the nearest whole number
For all majors except
major 3
, the admission rate is higher for the female
applicants. This reveals that the female applicants were not discriminated
against at all. If anything, it reveals the opposite. How can this reversal be
true? By examining
Table 6-10
, one can see that the majors with the largest
admission rates had a large number of male applicants and fewer females.
The majors that had the lowest admission rates had fewer males applying and
more females applying. That is, the variable of
major
was
confounding
the
gender
variable in the computation of the 44% of males who were accepted
and the 35% of females who were accepted. The apparent bias in these
percentages is due to the fact that in general, the female applicants were
applying to the most difficult majors for admission, and not to gender bias.
By considering the variable of major, the gender variable was removed from
the bias. That is, we say we are controlling for this confounding variable.
To give a different perspective, we will analyze the sample information for
the five majors using marginal and conditional distributions for the number
of students admitted.
The marginal distributions for those admitted by gender are given in
Table 6-12
.