


 254 / 762

254
Chapter 6: Categorical Data
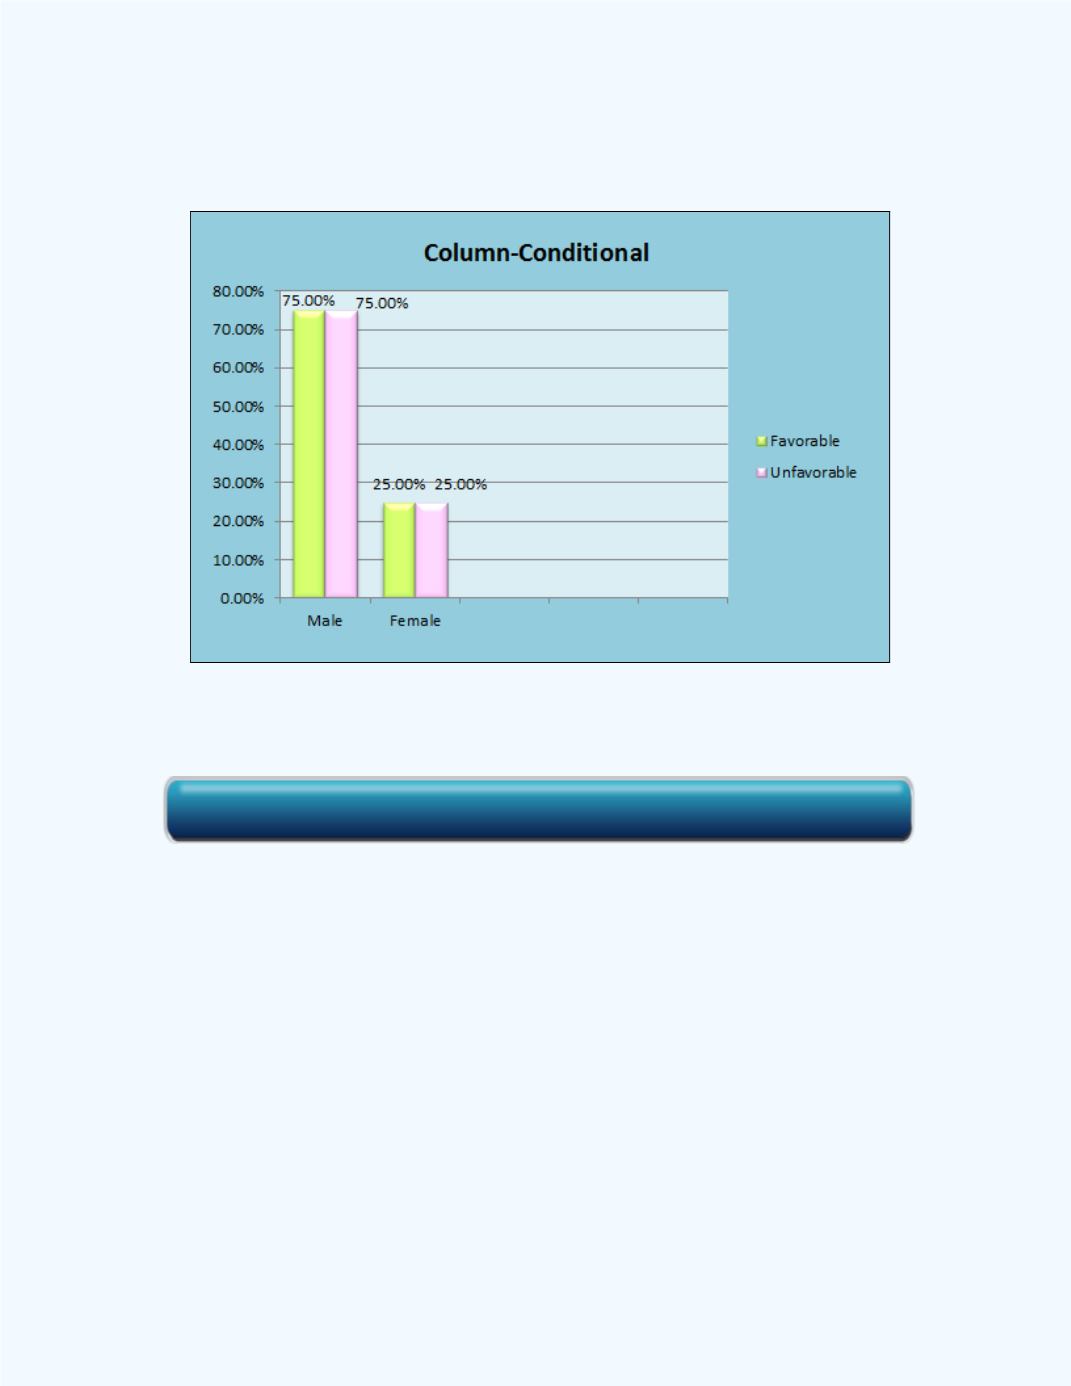
The graphical presentations of these column conditional distributions are
shown in
Figure 6-8
.
Figure 6-8:
Bar Graph displaying Conditional Distributions for
Gender Given Ratings for
Example 6-8(a)
(b)
Construct a table of the conditional distributions for the
favorable/unfavorable ratings given the gender classification.
Solution:
(b) Since we are conditioning on the gender classification, we
need to divide each cell entry by the row totals in the original 2
2 table.
These are expressed as percentages. The row conditional distributions are
given in
Table 6-9
.
Click here for the Contingency Table Workbook