


 249 / 762

Chapter 6: Categorical Data
249
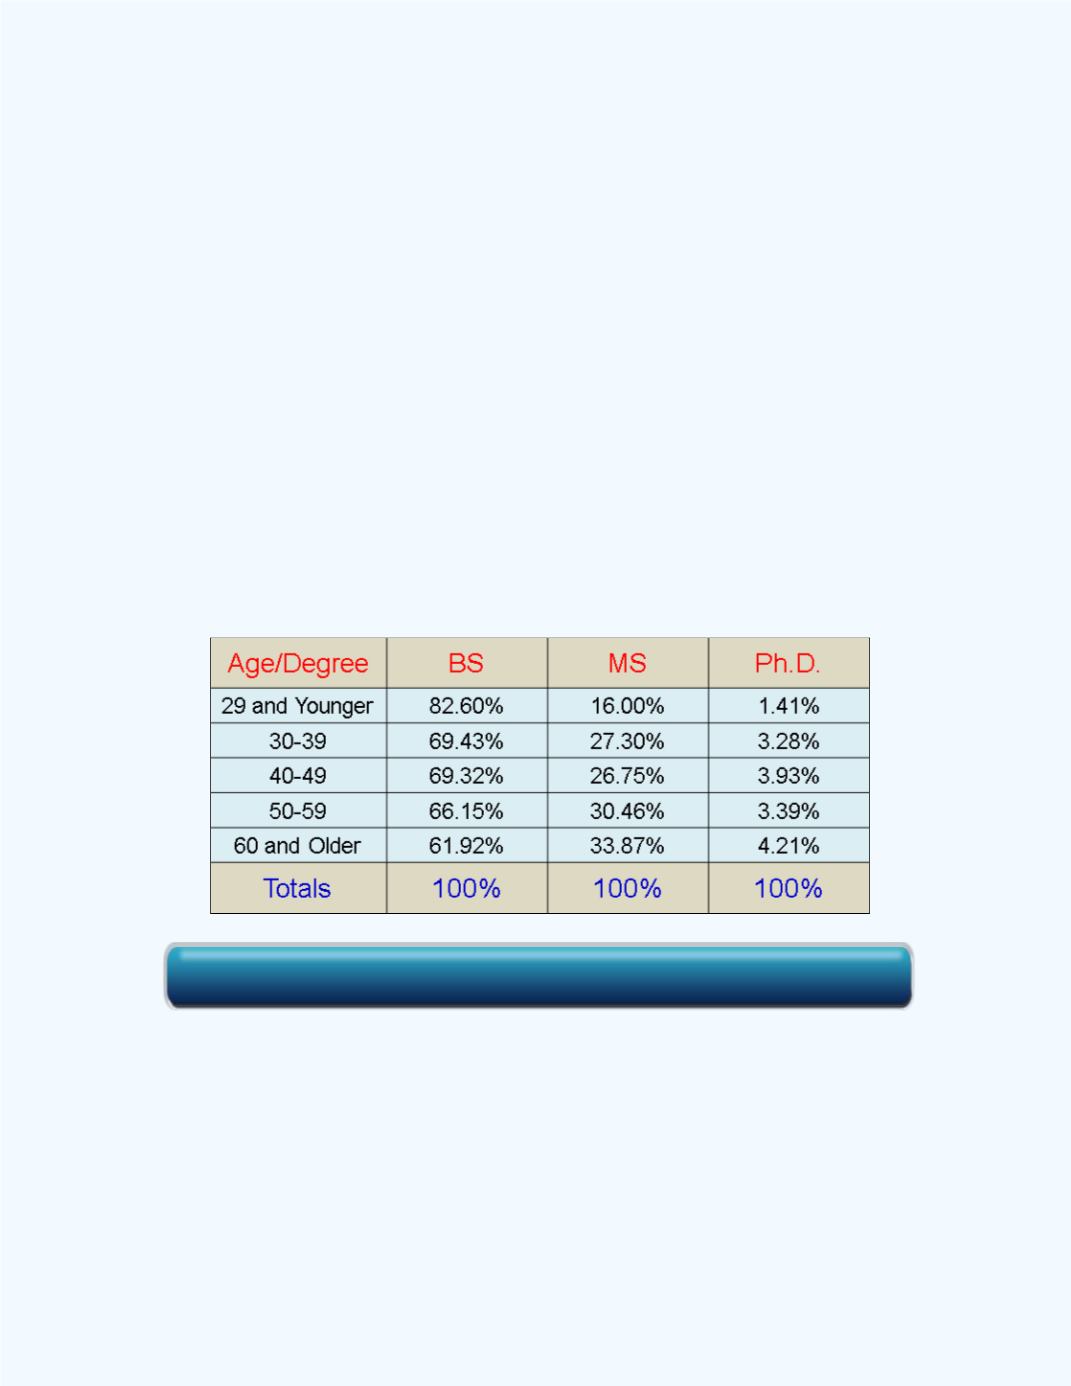
Example 6-5:
Compute the conditional distributions for the degree
classifications (column) given the age classifications (row) for the data given
in
Example 6-1
. Use two decimal places.
Solution:
From the original two-way distribution, we need to compute each
frequency entry as a percentage of the respective row totals.
For the BS degree classification, the conditional distribution for the entry
4286, given the 29 and younger classification, will be (4286/5189)
100 % =
82.60%. For the Ph.D. degree classification, the conditional distribution for
the entry 261, given the 60 year and older, will be (261/6198)
100 % =
4.21%. One can continue in this manner to compute the remaining
conditional distributions for the columns given the rows. The conditional
distributions are given in
Table 6-6
.
Table 6-6:
Conditional Distributions for the Degree Given
Age
Question:
How do you interpret the values for the conditional distributions
given in
Table 6-6
?
We will explain with an illustration in the following example.
Example 6-6:
Interpret the value of 27.30% in
Table 6-6
.
Click here for the Contingency Table Workbook