


 248 / 762

248
Chapter 6: Categorical Data
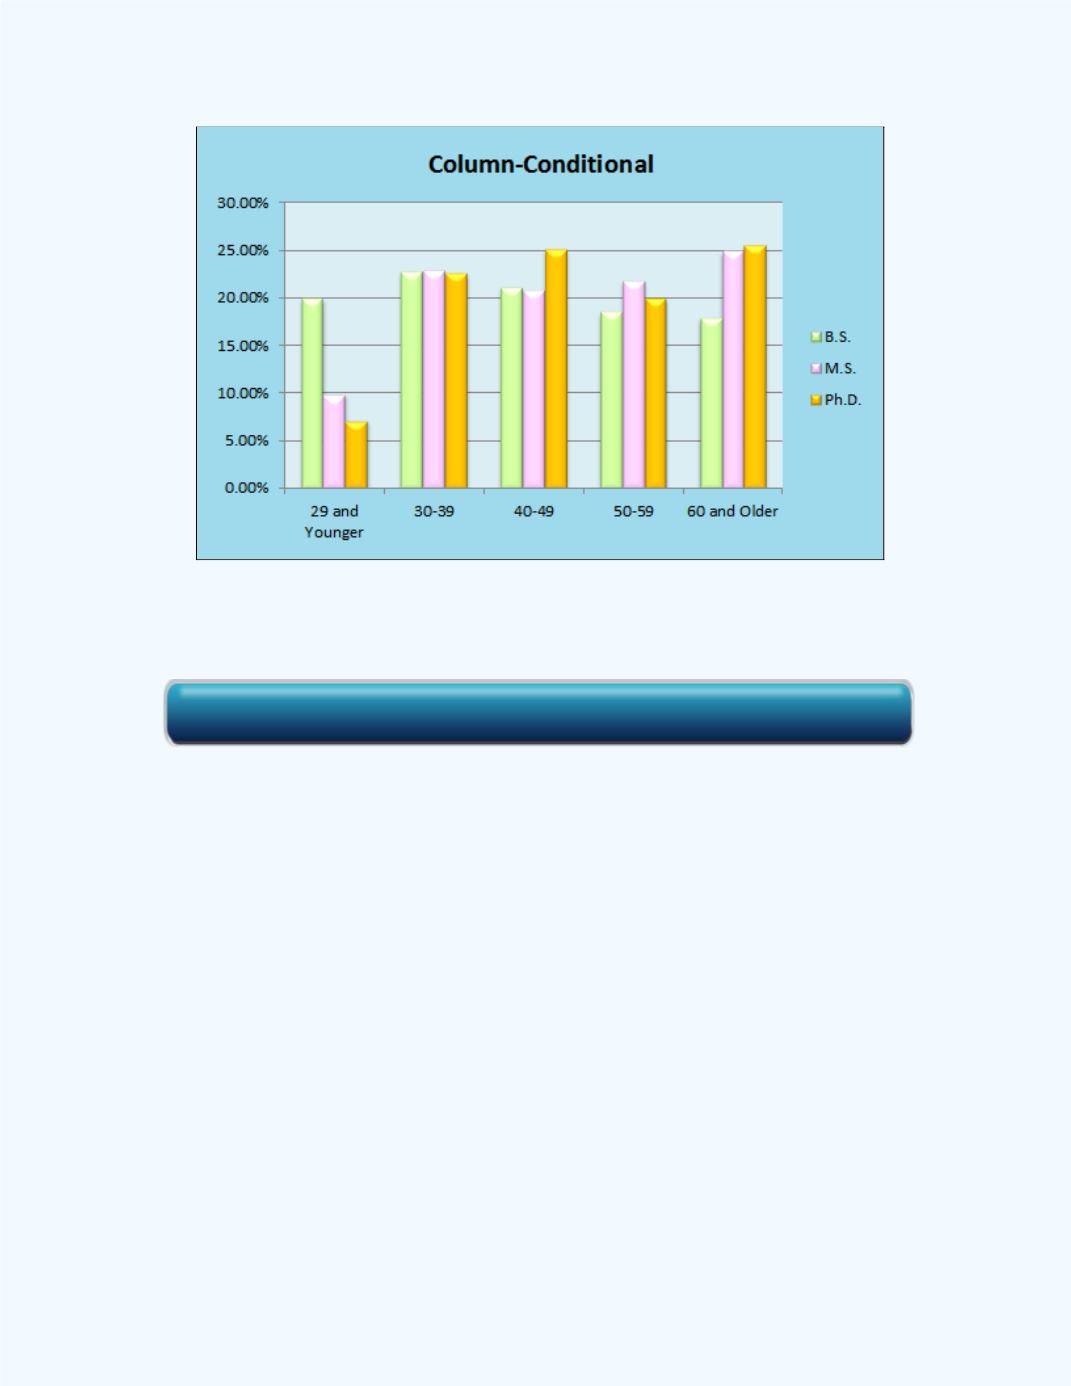
Figure 6-4:
Bar Graph displaying Conditional Distributions for
Age Given Degree for
Example 6-2
From
Figure 6-4
, one can observe that within the age group of females who
were 29 and younger, the largest percentage was associated with attainment
of a BS degree. For the age group of 60 and older, significantly more
females obtained MS and Ph.D. degrees. Also, there was not much
variability in degree attainment for the other three age group categories.
Example 6-4:
Interpret the value of 7.11% in
Table 6-5
.
Solution:
The value of 7.11% indicates that 7.11% of the females with a
Ph.D. degree are 29 years of age and younger for the reported data.
Click here for the Contingency Table Workbook