


 247 / 762

Chapter 6: Categorical Data
247
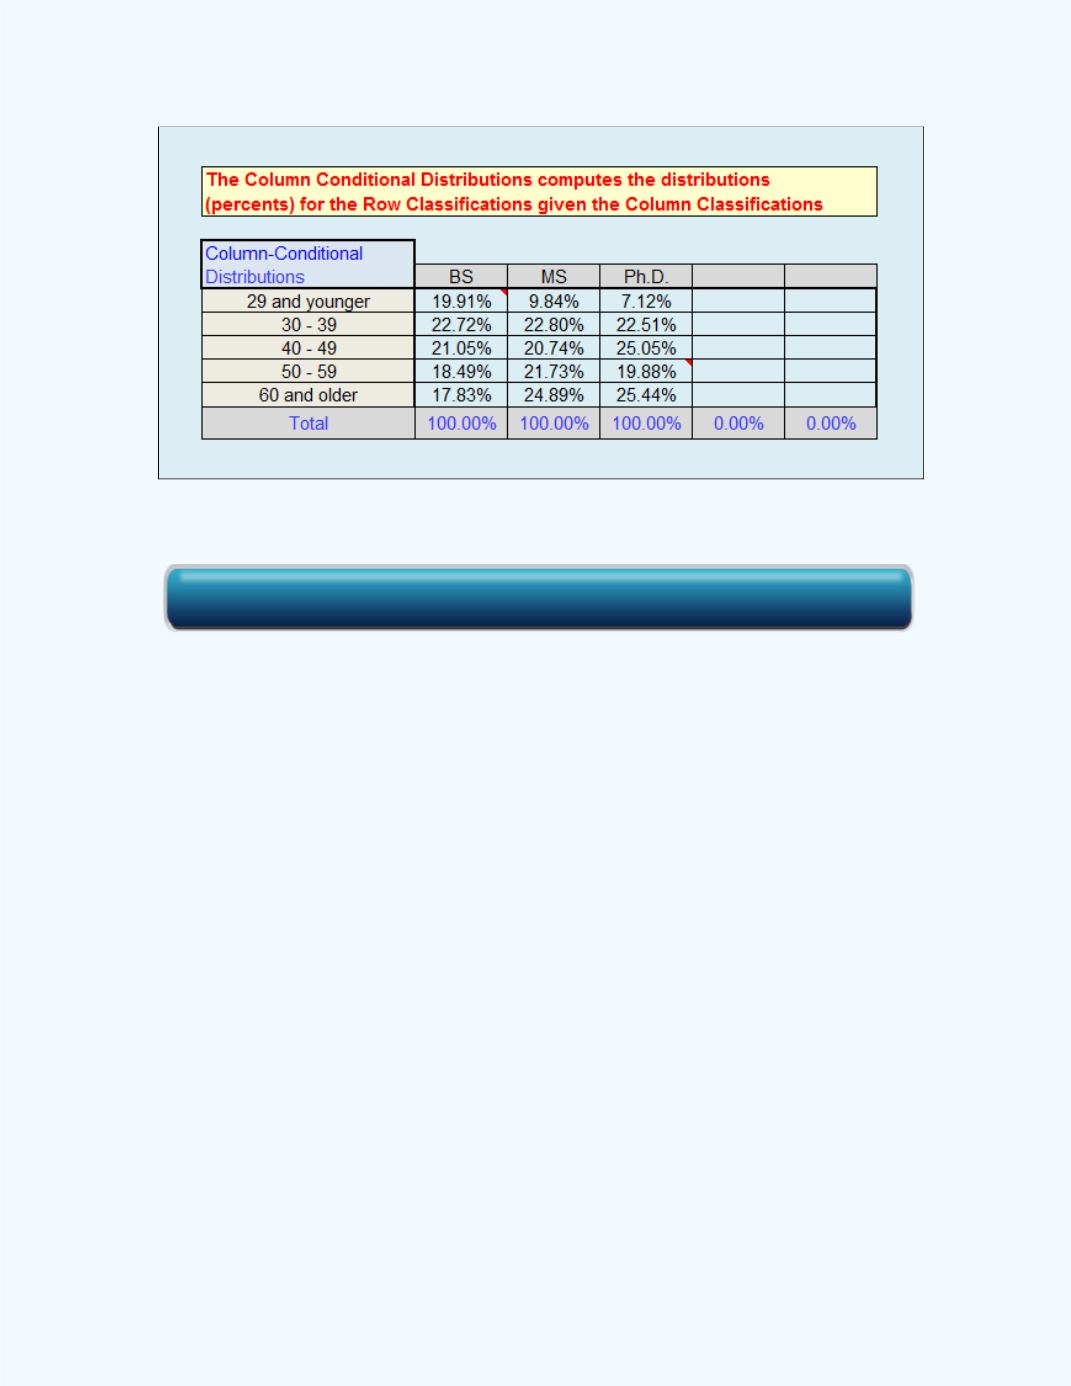
Figure 6-3:
Conditional Distributions for Age Given Degree
The
Contingency Table
workbook automatically generates a bar graph to
display these column conditional distributions. The conditional distributions
for the age classification given the degree classification for
Table 6-5
are
graphically displayed in
Figure 6-4
.
Click here for the Contingency Table Workbook