


 244 / 762

244
Chapter 6: Categorical Data
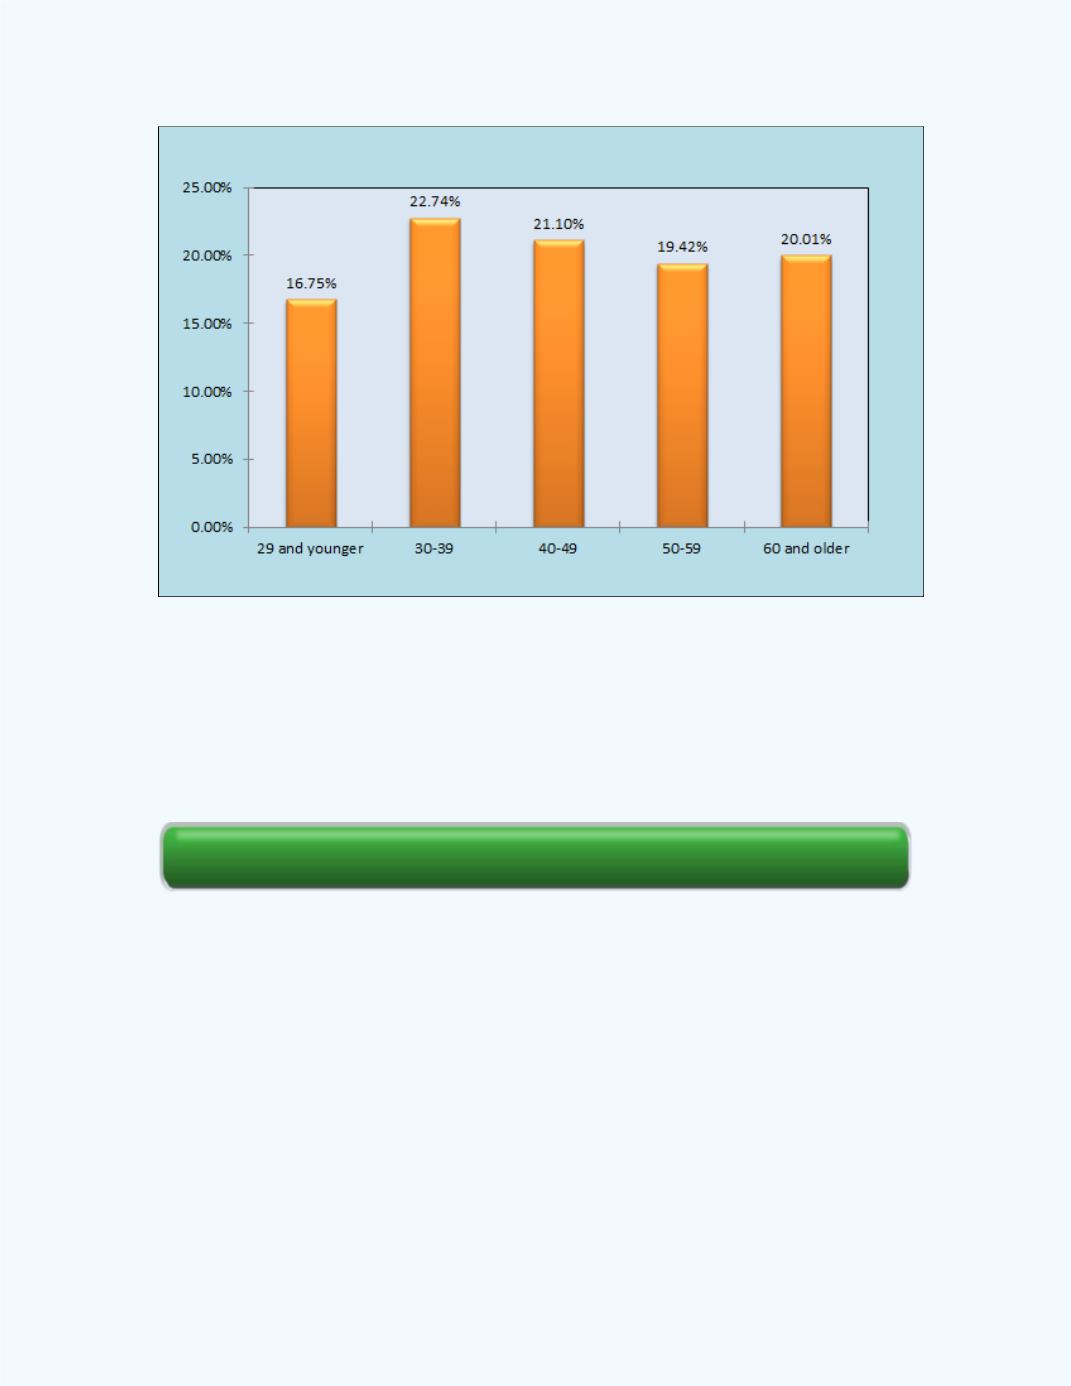
Figure 6-2:
Bar chart for the Marginal Distributions for the
Age Classification
Section Review
6-3 Conditional Distributions
From the contingency table, one can obtain the distribution of one variable
given the other variable. For example, one may be interested in finding the
proportion of females who are 50 or older, given that they have earned a MS
degree. In this case, we are looking for a row classification given a column
classification. One can also consider a column classification given a row
classification. The proportions computed from such analysis are called
conditional distributions. Thus, one may formulate a definition for the
conditional distribution as given below.
e-Self Review