


 241 / 762

Chapter 6: Categorical Data
241
Solution:
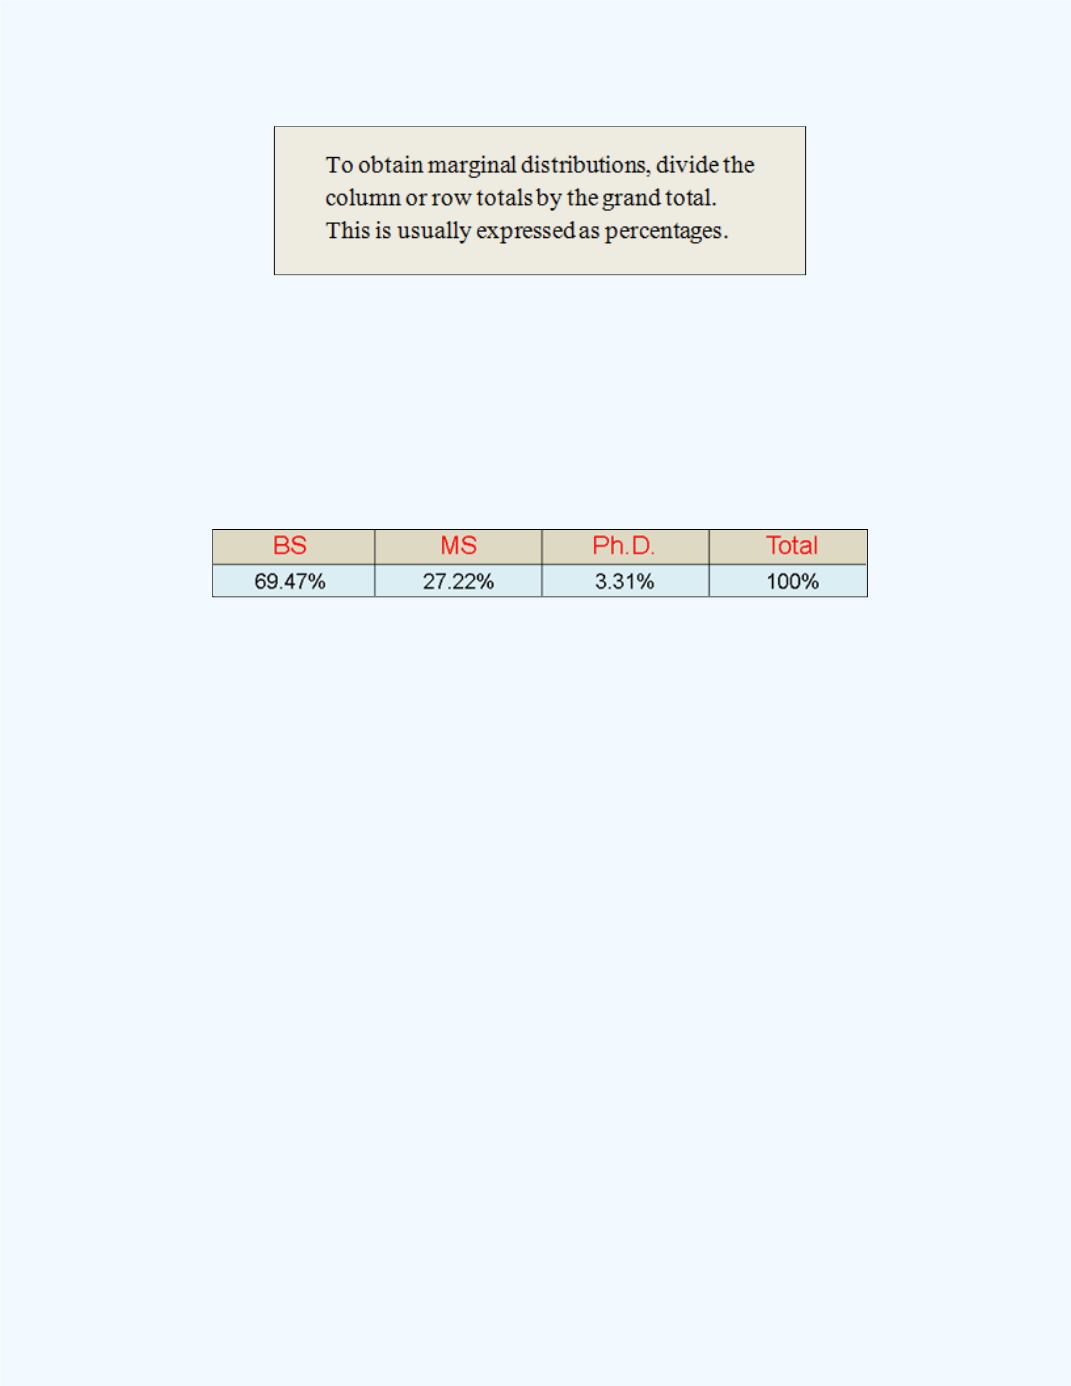
(b) We need to divide the column totals of 21,527, 8,434, and
1,026 by the grand total of 30,987 to obtain the column marginal
distributions. The column marginal distributions, in percents, for the
classification variable of degree are given in
Table 6-3
.
Table 6-3:
Summary of the Marginal Distributions for the
Degree Classification
Observe that the sum of the marginal percentages equals 100 %.
From the marginal distribution, one can observe that 69.47 % of the females
in the survey obtained a BS degree, 27.22 % earned a MS degree, and 3.31 %
earned a Ph.D. Also, one can observe that the percentage of BS degrees
obtained was more than twice that obtained for the MS and Ph.D. degrees
awarded combined. This is not surprising since a large majority of students
do not pursue a graduate degree after obtaining a BS degree.
Note:
The ideal graphical display used to present data in contingency tables
is the bar chart. We will use the bar chart to display the original, the
marginal and the conditional distributions when appropriate.
The marginal distributions for the degree classification for
Table 6-3
are
graphically displayed in
Figure 6-1
.