


 242 / 762

242
Chapter 6: Categorical Data
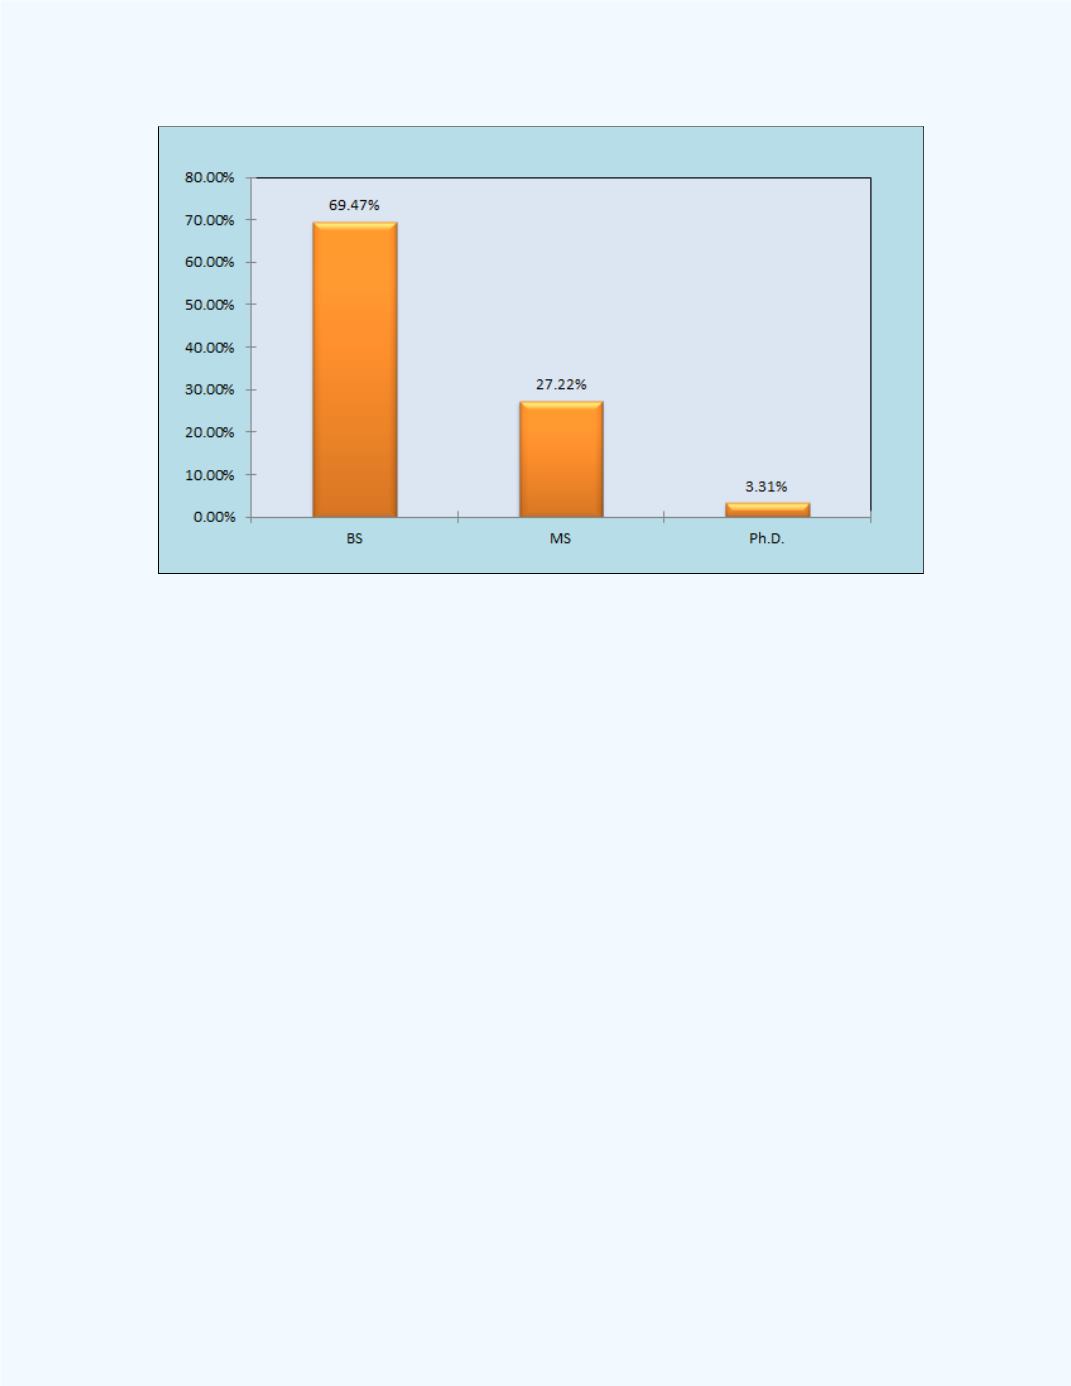
Figure 6-1:
Bar chart for the Marginal Distributions for the
Degree Classification
(c)
Compute the marginal distributions for the age group variable.
Solution:
(c) We need to divide the row totals of 5189, 7045, 6538, 6017
and 6198 by the grand total of 30987 to get the row marginal distributions.
The row marginal distributions, in percents, for the classification variable of
age are given in
Table 6-4.