


 243 / 762

Chapter 6: Categorical Data
243
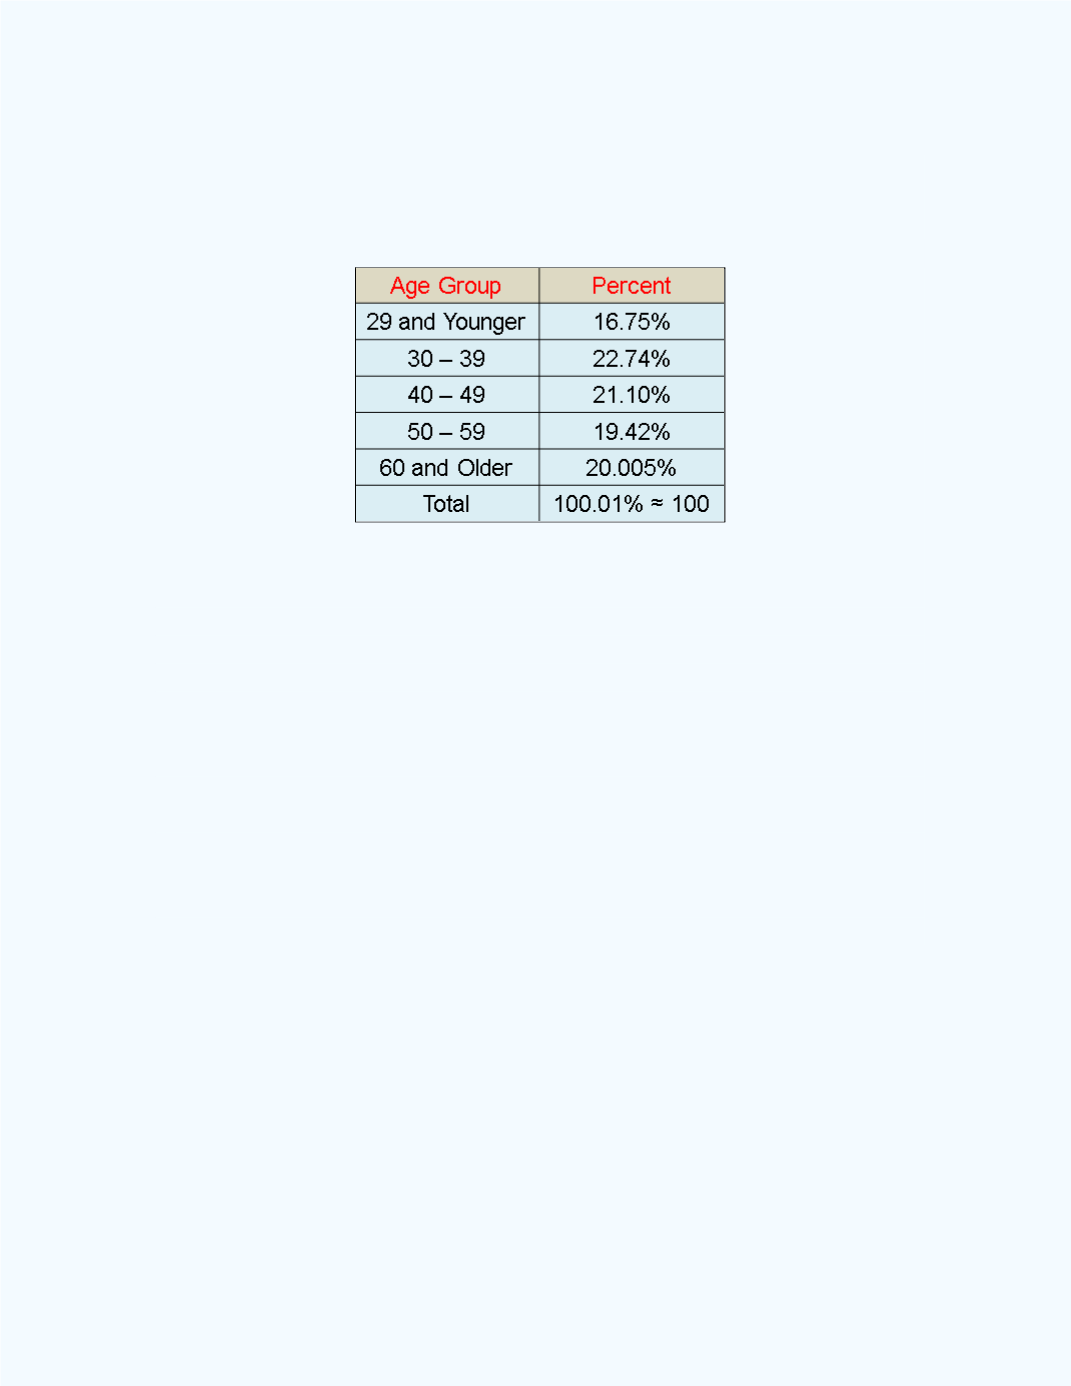
Table 6-4:
Summary of the
Marginal Distributions
for the Age Classification
Note:
The marginal distributions (percent) column should add up to 100%.
Because of rounding to two decimal places, it added up to 100.01%.
Observe that the sum of the marginal distributions (percentages) should
always equal to 100 %. From the marginal distributions, one can observe
that the age group of 29 years and younger, had the smallest marginal
distribution. The marginal distributions for the other age groups do not have
a large variability in the percentages. From the marginal distributions, one
can also observe that the age group of 30 - 39, had the largest marginal
distribution.
These marginal distributions for the age classification for
Table 6-4
are
graphically displayed in
Figure 6-2
.