


 239 / 762

Chapter 6: Categorical Data
239
classification indicates that 4,532 out of the 30,987 females who obtained a
BS degree were between 40 – 49 years of age. That is, about 14.63 percent
of the total observed values were females who earned a BS degree and were
between 40 – 49 years of age. Also, there were only 1749 females in the
same age group who earned a MS degree. This would represent 5.64 percent
of the total observed values. However, the 4,532 were out of a total of
21,527 BS degrees, or 21.05 percent, while the 1,749 were out of a total of
8,434 MS degrees or 20.74 percent. Thus, the relationship between these two
qualitative variables may be better analyzed and understood by using the
appropriate percentages. We will explore the relationship between two
qualitative variables by using marginal distributions. In addition we will
further analyze with conditional distributions presented in the next section of
the e-book.
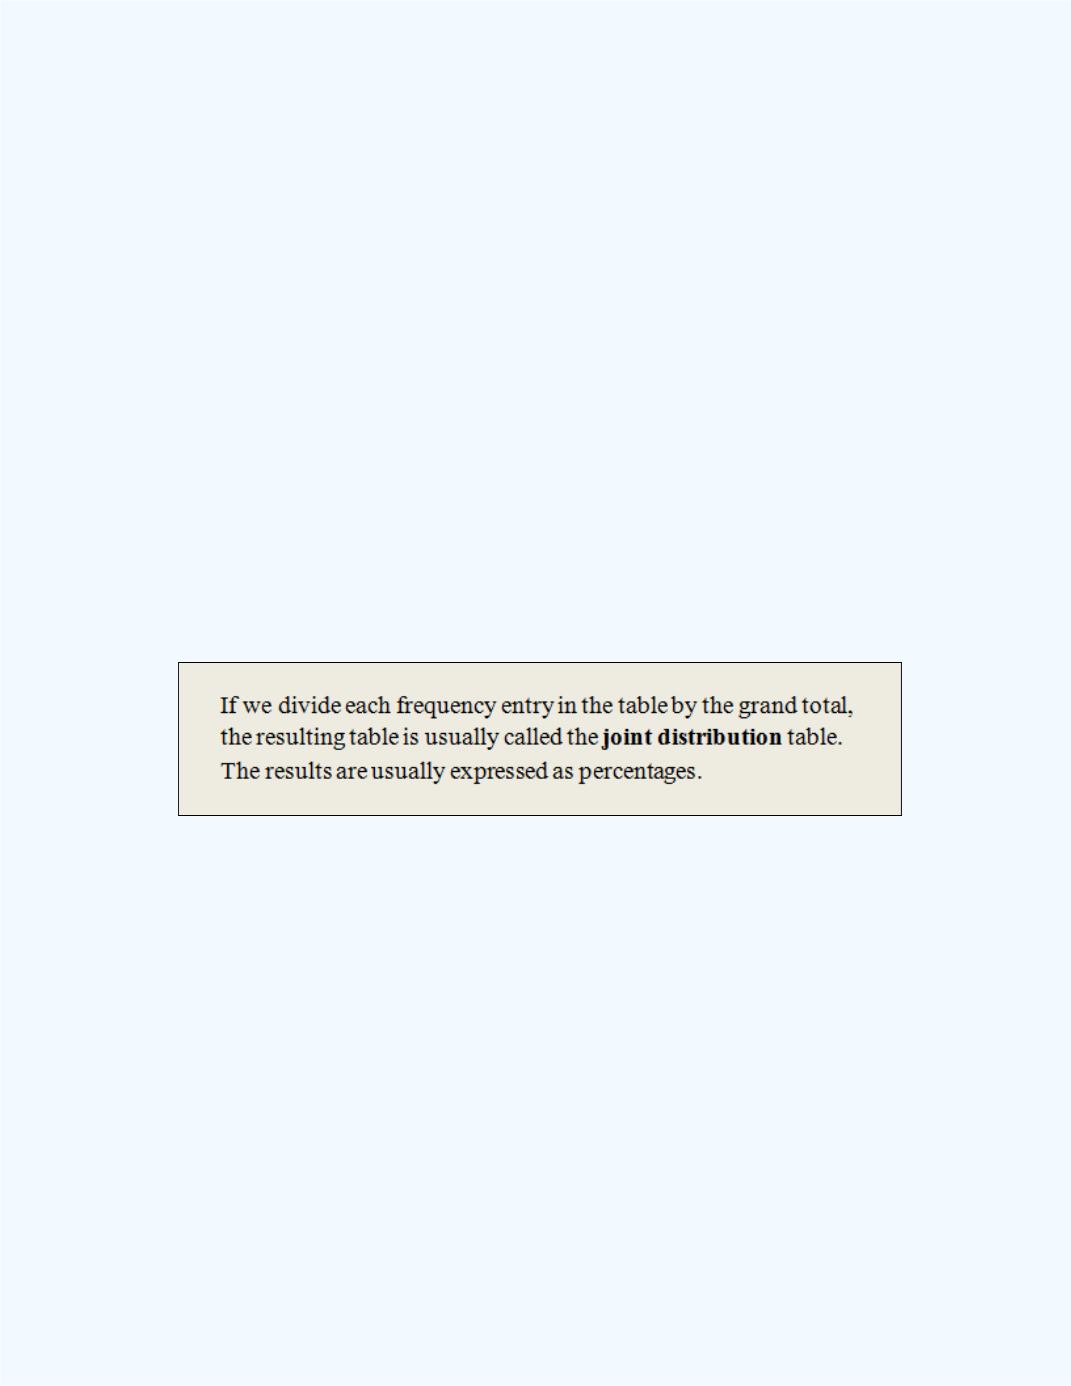
Joint Distributions
First we will explain what we mean by the joint distributions for a
contingency table.
(a)
Compute the joint distributions for the information given in
Table 6-1
.
Solution:
(a) The joint distributions are shown in
Table 6-2.