


 251 / 762

Chapter 6: Categorical Data
251
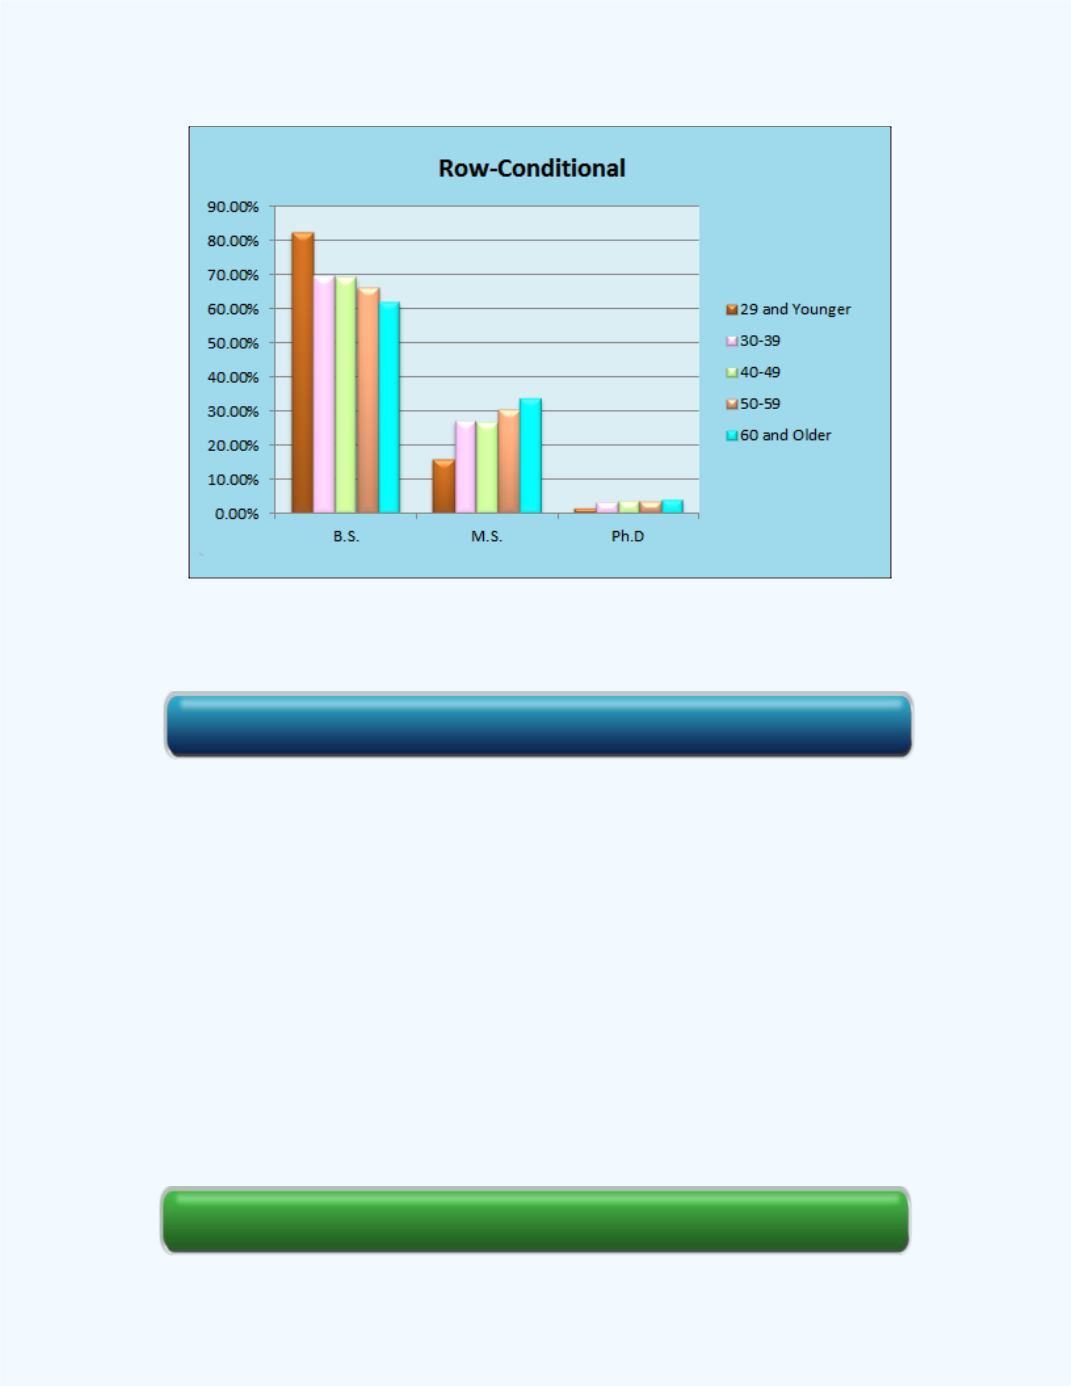
Figure 6-6:
Bar Graph displaying Conditional Distributions for
Degree Given Age for
Example 6-5
From
Figure 6-6
, from the display, one can observe that within the BS
degree classification, the percentage for the 29 and younger age group is the
largest. For the MS and Ph.D. degree classifications one can observe that for
the different age groups, significantly less females obtained MS and Ph.D.
degrees when compared to the BS degree classification.
Example 6-7:
Interpret the value of 69.32% in
Table 6-6
.
Solution:
The value of 69.32% of the females in the survey who were
within the 40 and 49 age group earned a BS degree.
Section Review
e-Self Review Click here for the Contingency Table Workbook