


 232 / 762

232
Chapter 5: Bivariate Data
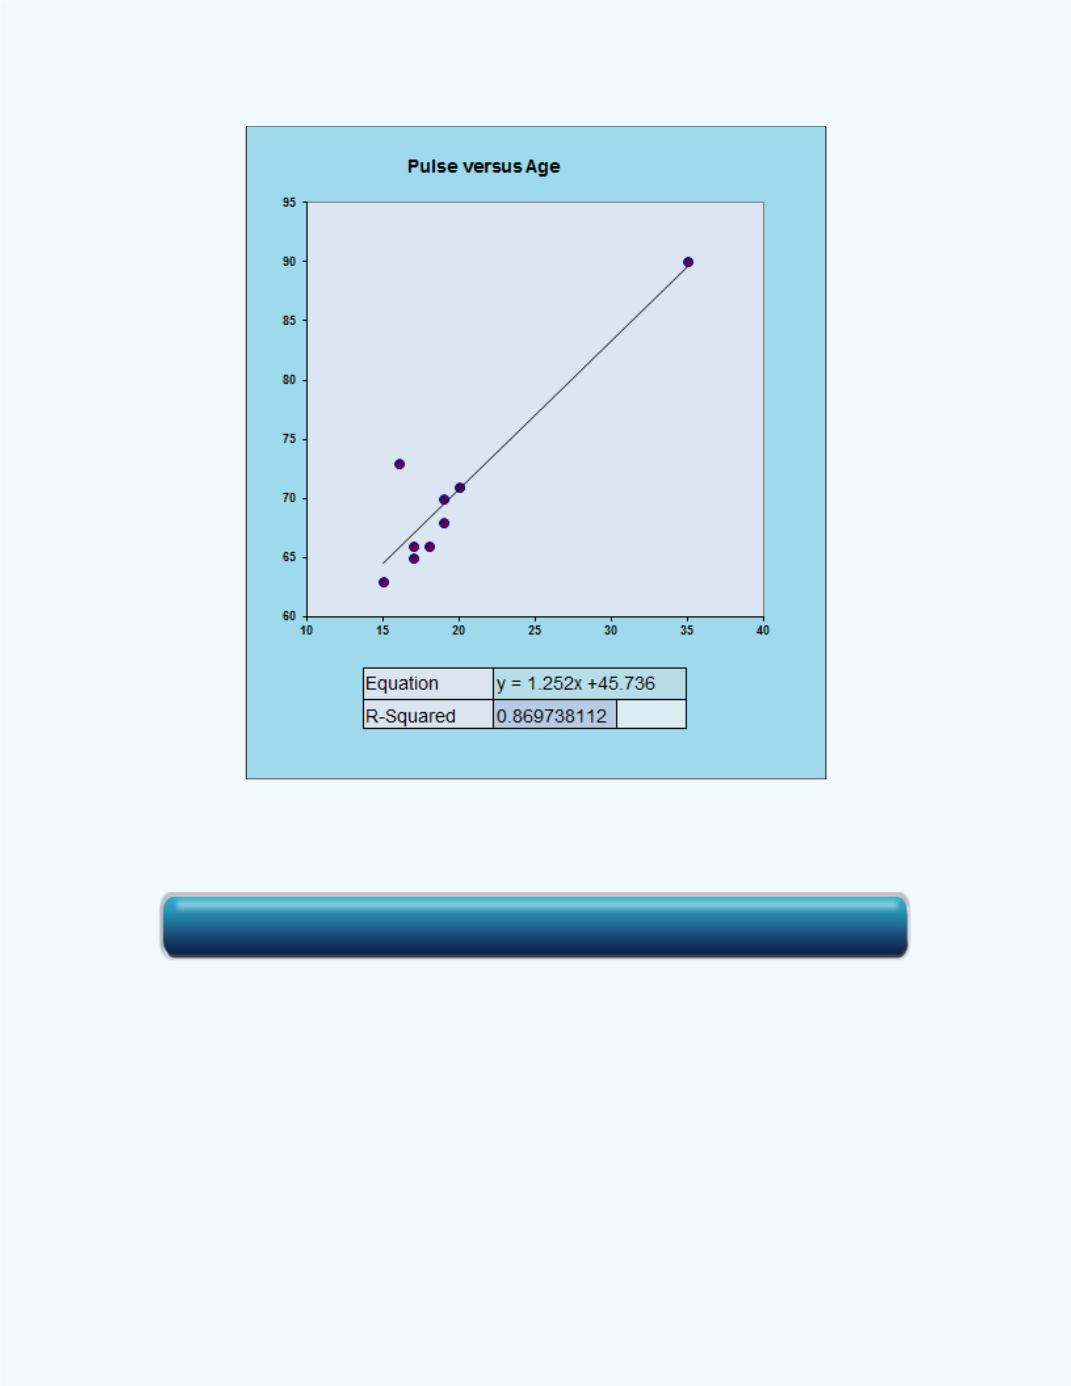
Figure 5-33:
Scatter Plot with Line of Best Fit
for
Example 5-10
The points with arrows pointing to them in
Figure 5-34
are examples of an
outlier and an influential point. Notice that the outlier is only an outlier with
respect to the
value of the point, not the
value. Notice that the influential
point is an outlier with respect to both the
value and the
value of the
point.
Click here for the Simple Regression Workbook