


 228 / 762

228
Chapter 5: Bivariate Data
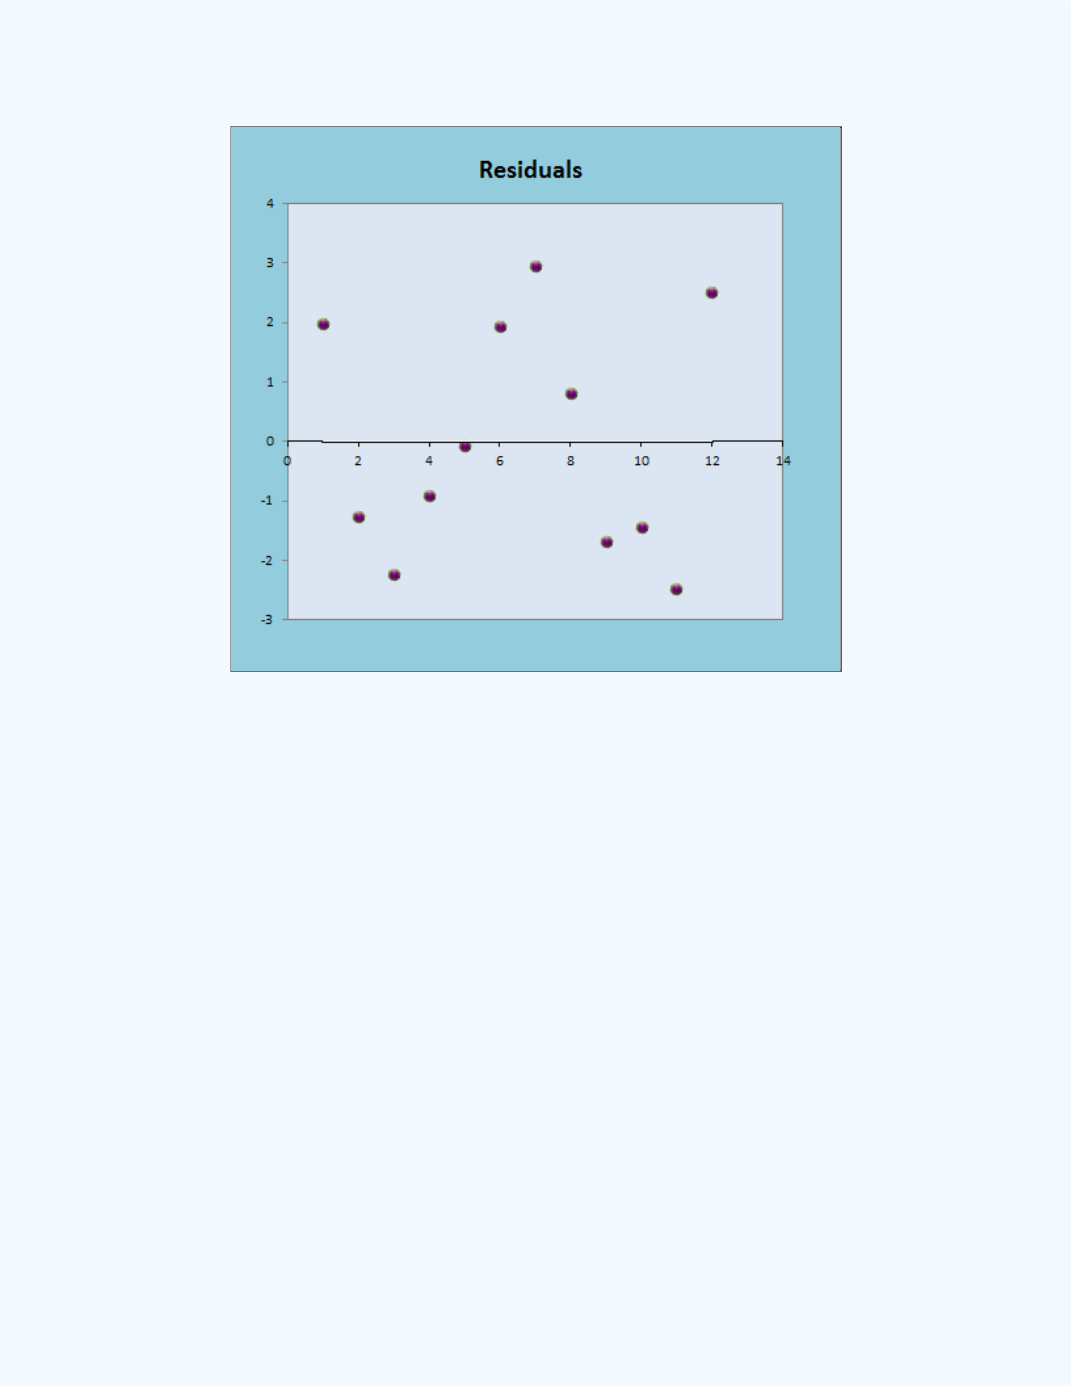
Figure 5-30:
Scatter Plot of the Residuals for the 1986 Data
If we assume a constant model as shown in
Figure 5-31
, we can see that
the correlation coefficient for the constant model is practically equal to zero.