


 231 / 762

Chapter 5: Bivariate Data
231
There are three different possible ways an outlier may exist when dealing
with simple regression analysis. They are as follows:
Separation from the line of best fit in the vertical (
) direction.
Separation from the line of best fit in the horizontal (
) direction.
Separation from the line of best fit in both directions.
In addition, an observation that causes the values of the slope and the
intercept in the line of best fit to be considerably different from what they
would be if the observation were removed from the data set is said to be an
influential
point.
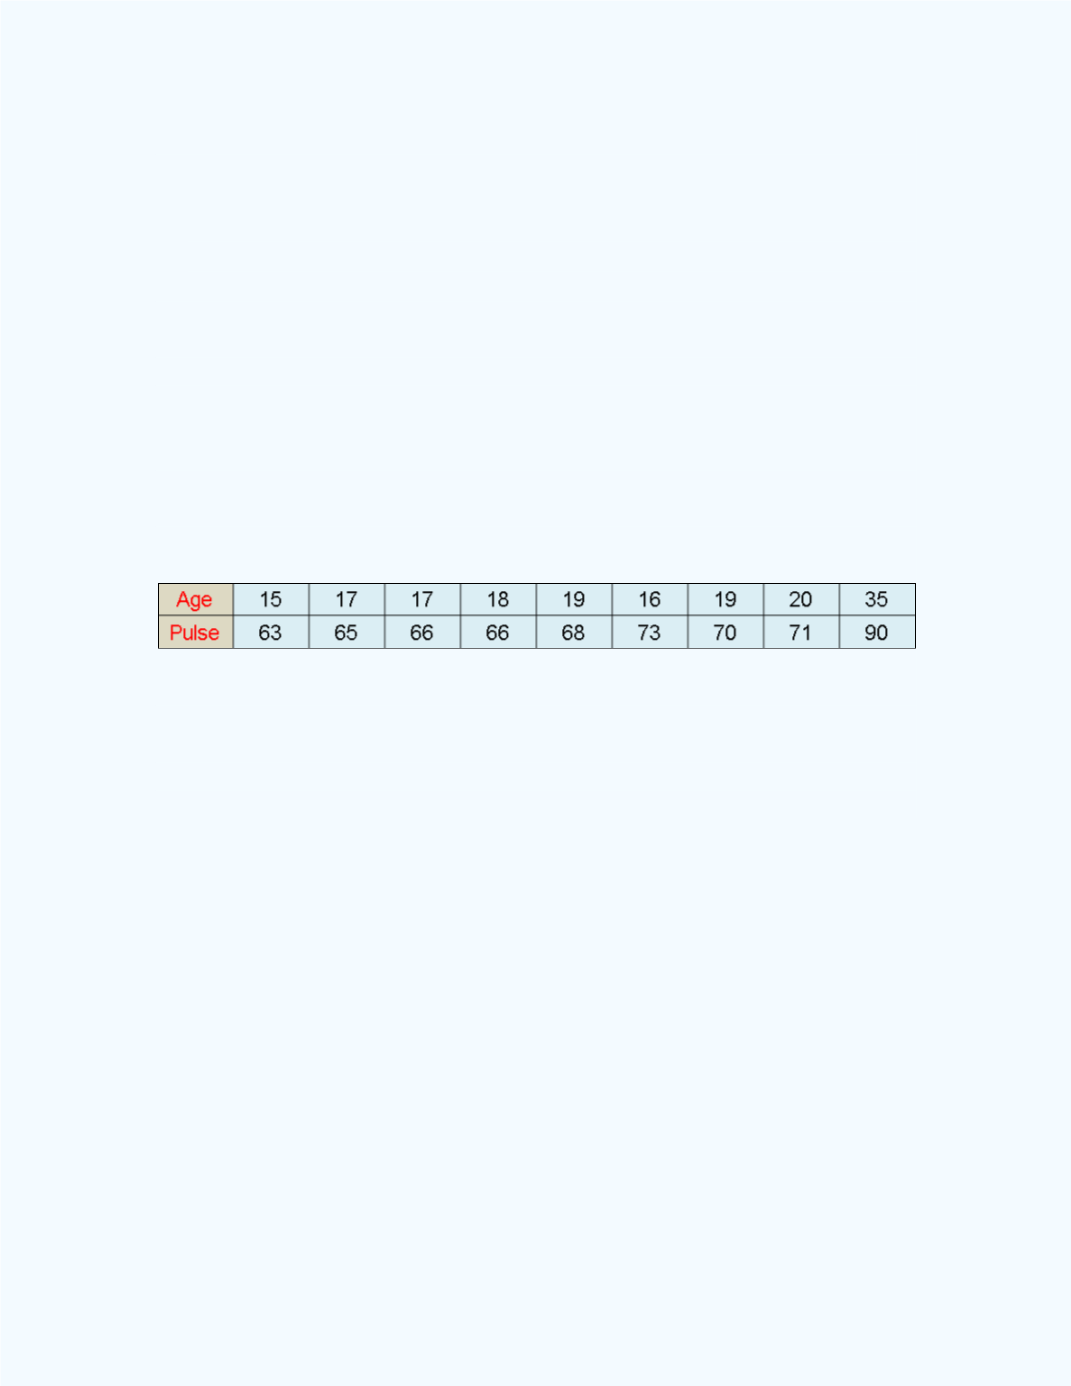
Example 5-10:
The following data shows the resting pulse rate for a
sample of males along with their ages. Present the data in a scatter plot with
the line of best fit superimposed on the plot.
Solution:
Figure 5-33
displays a fitted line plot showing the least squares
regression line and the
-squared value. Note that the independent variable
is the Age of Male Subjects and the dependent variable is the Resting Pulse
Rate.