


 230 / 762

230
Chapter 5: Bivariate Data
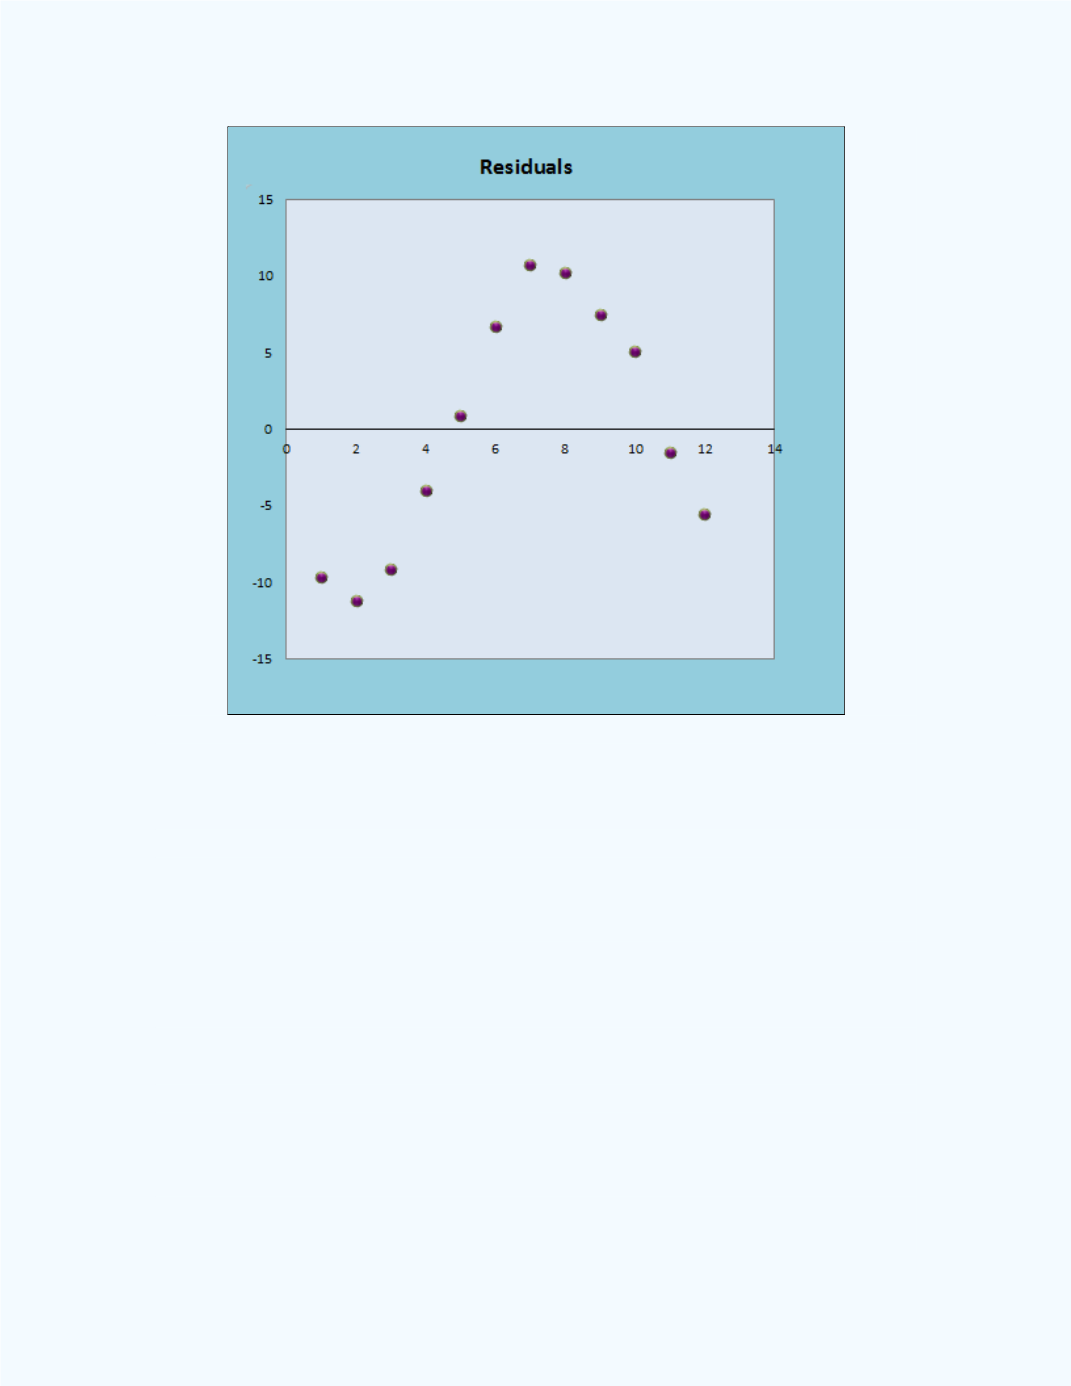
Figure 5-32:
Residual Plot for the constant model for the 1986 Data
The residual plot is suggesting that the constant model is not appropriate. It
is suggesting that a non-linear model is appropriate.
If we try to fit a linear or quadratic model, we will observe the same pattern
in the residual plot suggesting that the linear and quadratic modes are also
not an appropriate fit. You can use the workbook and verify.
5-9 Outliers and Influential Points
In general, outliers are points that exhibit considerable separation from the
norm, when compared to the other points in the data set. With respect to the
line of best fit, an outlier is a an observation with a large negative or positive
residual value. That is, an outlier will fall far from the regression line and
will not follow the pattern of the linear relationship expressed by the line of
best fit.