


 225 / 762

Chapter 5: Bivariate Data
225
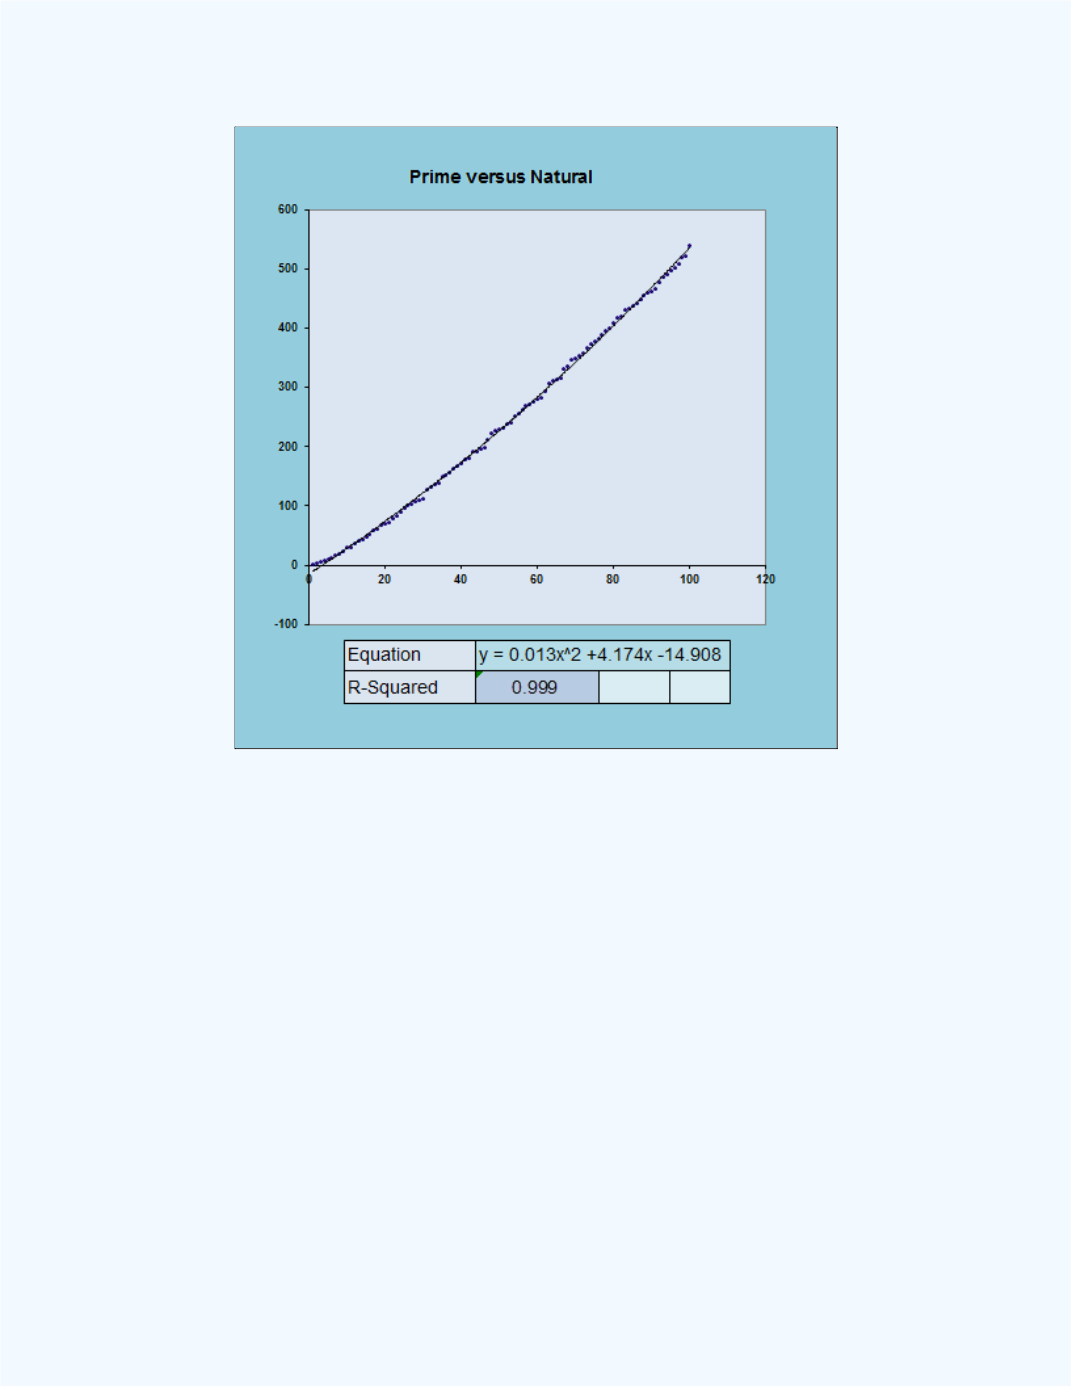
Figure 5-28:
Quadratic Fit to Prime Numbers versus
Natural Numbers
In conclusion, even when the model appears quite good, a plot of the
residuals versus the independent variable(s) may reveal a pattern indicating
otherwise. If the form of the regression model is incorrect, the residual plots
will often show a pattern that can be used to propose a more appropriate one.
When a choice exists between a simpler model, the linear one in this case,
and a more complex model, the quadratic one in this case, one must weigh
the cost of the extra complexity against the benefit of the increase in model
fit. In this case, we would certainly adopt the linear model, otherwise we
trade significant complexity for a slight gain in fit.
It is possible to have other curved patterns when residuals are plotted.
However, if a linear model is used to generate the residuals, one should
reevaluate the model and adjust for the curvature.