


 221 / 762

Chapter 5: Bivariate Data
221
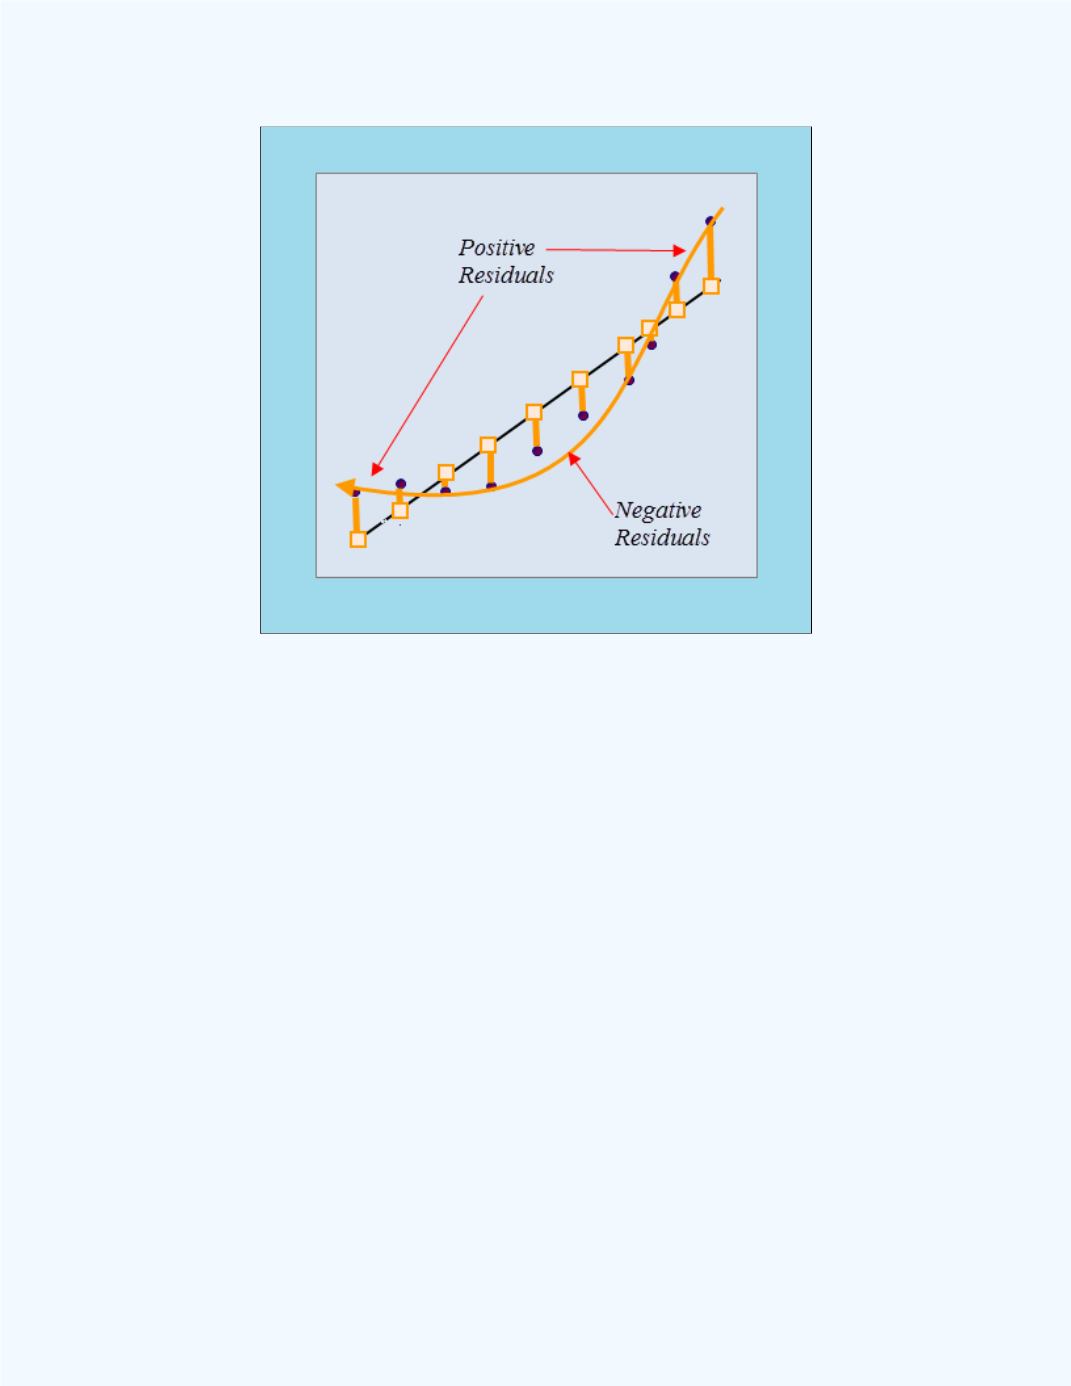
Figure 5-24:
Non-linear residual plot
Note in
Figure 5-24
that the residuals for low
values and high
values are
positive while the residuals for the intermediate values of
are negative.
The predicted values are represented by the squares on the straight line.
When these residuals are plotted against
, a curved pattern will result as
shown in
Figure 5-25
.