


 223 / 762

Chapter 5: Bivariate Data
223
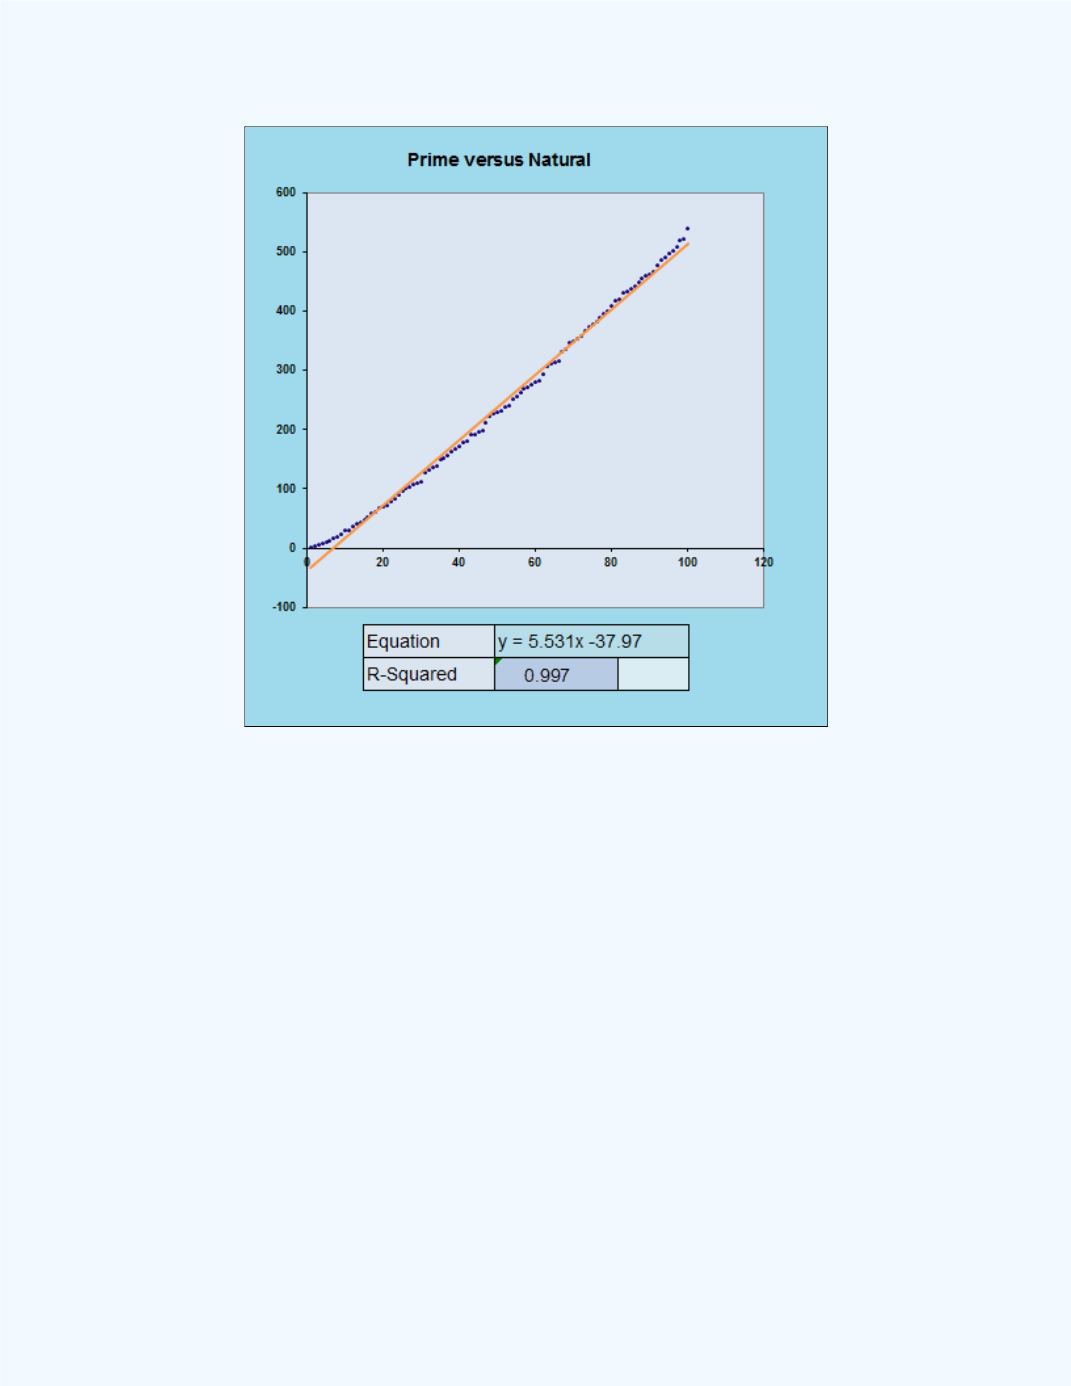
Figure 5-26:
Plot and Model for Prime versus
Natural Numbers
A plot of the residuals versus the independent variable, shown in
Figure 5-27
, indicates a pattern other than a linear one. After all, the
-squared value was nearly 100%. This pattern is quadratic or second
degree in nature. That is, this would suggest that the model contains a term
with a power of two.