


 220 / 762

220
Chapter 5: Bivariate Data
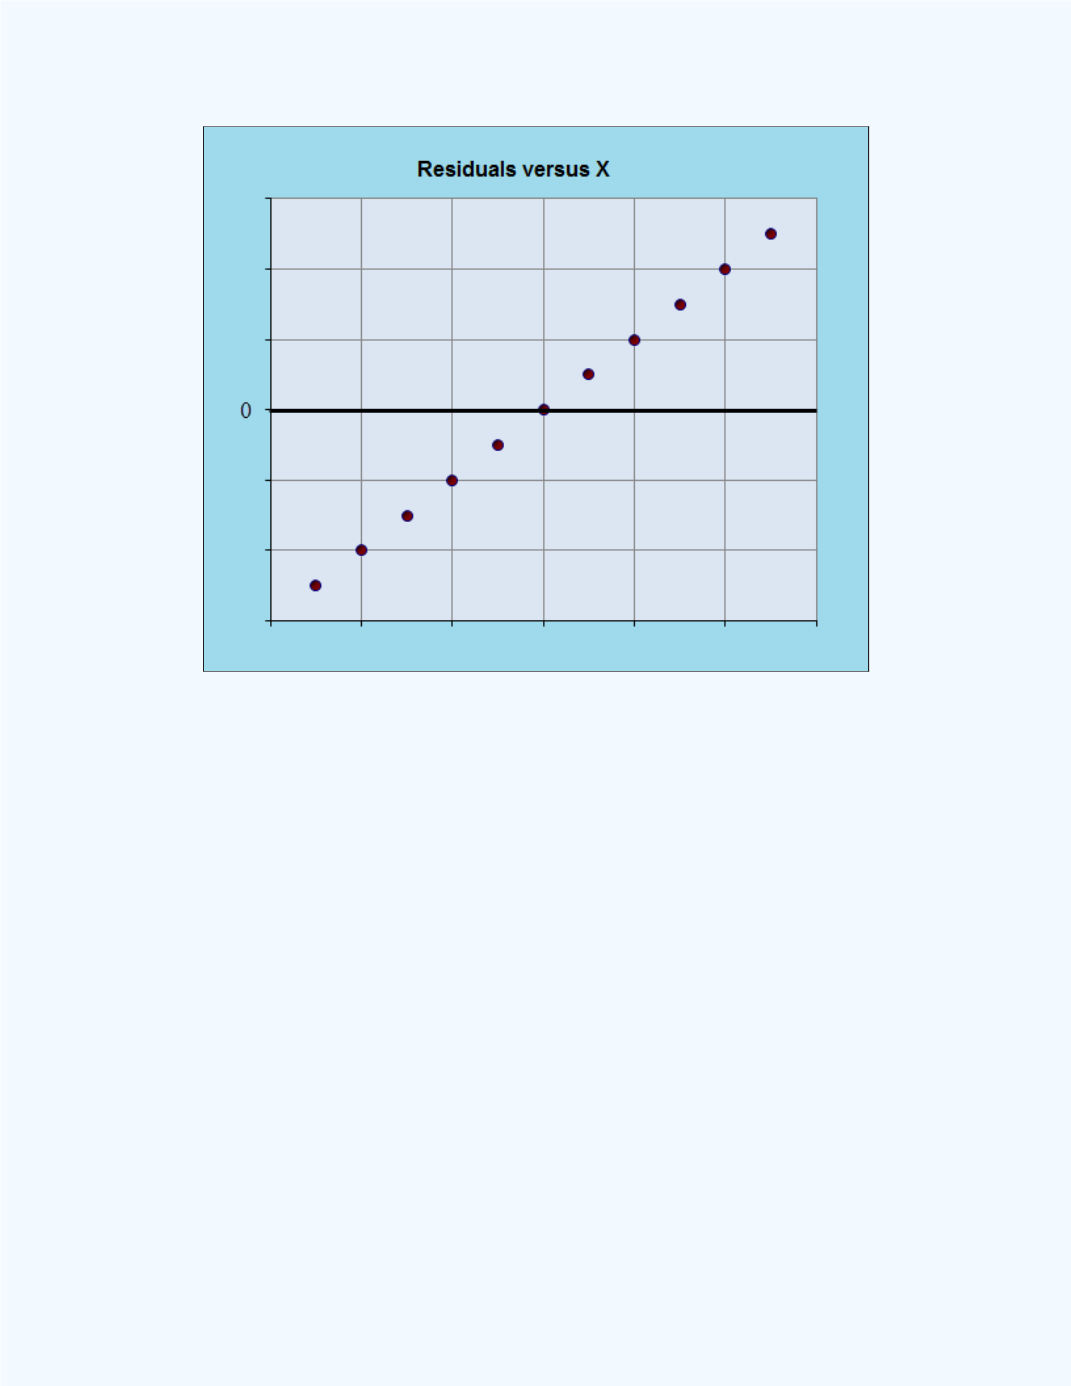
Figure 5-23:
Linear residual plot
Let us consider another illustration.
Illustration 2:
If for instance one assumes a linear model for a bivariate
data set and the resulting residual plot versus the independent variable
x
,
displays a nonlinear pattern, this would suggest that the linear model is not
appropriate for the data. In this situation one would need a more complex
model to accommodate for the suggested nonlinear nature of the data. Refer
to
Figure 5-24
. Observe that the actual values display a non-linear pattern
while the predicted values are on a straight line.