


 197 / 762

Chapter 5: Bivariate Data
197
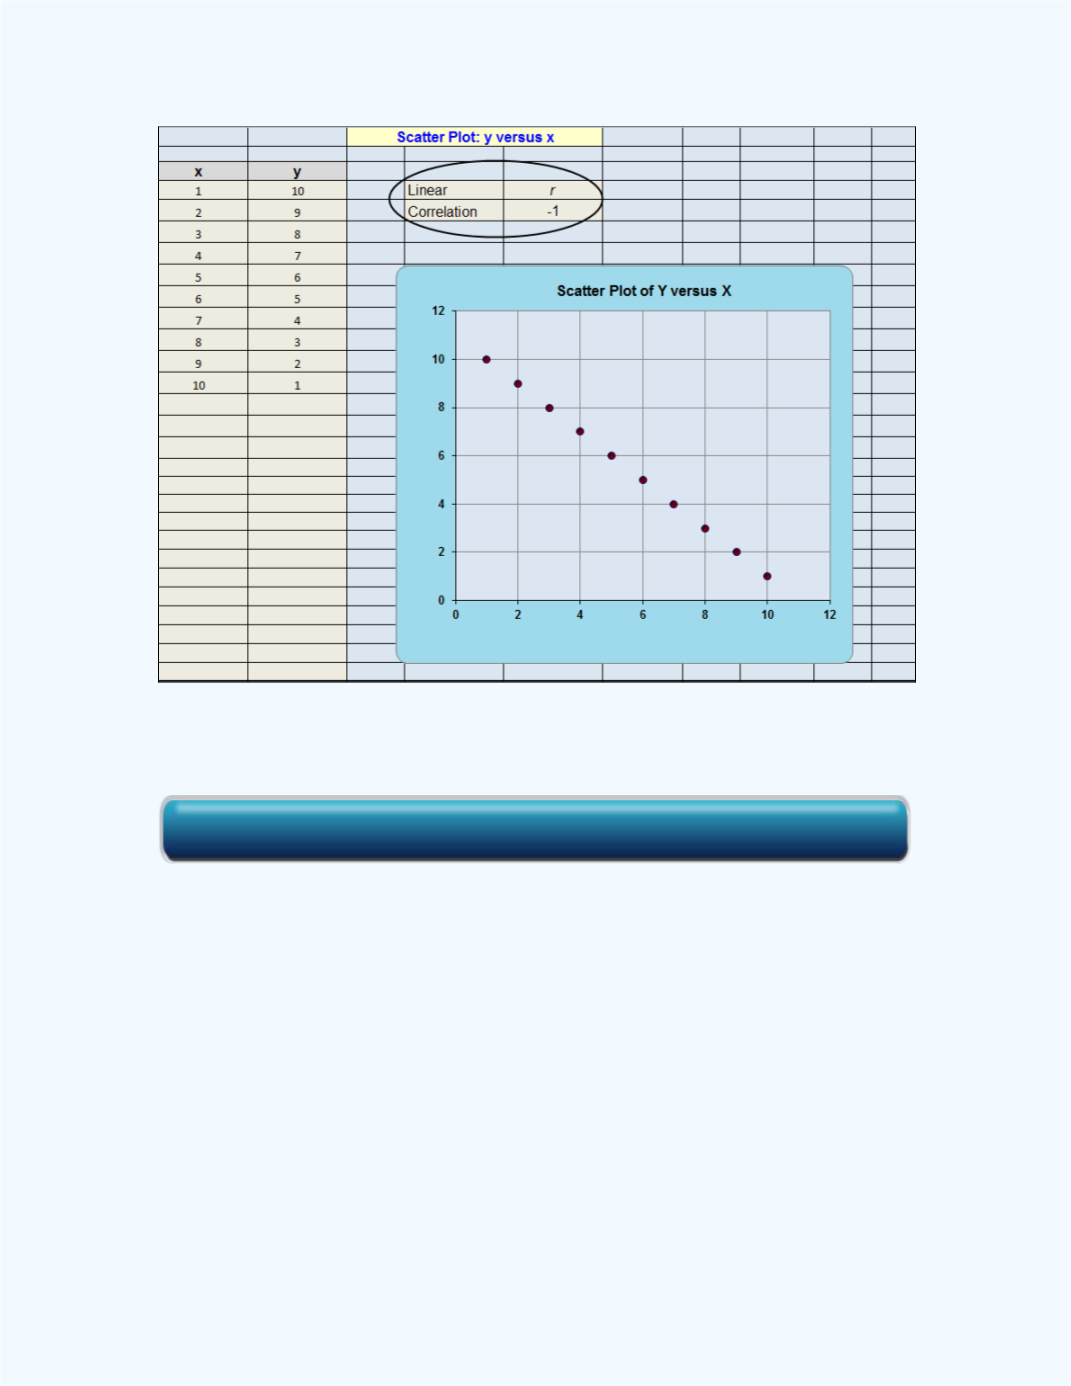
Figure 5-11:
Output showing the correlation coefficient of
-1 for a perfect negative association
If there is a “strong” positive linear relationship between the variables,
the value of
will be close to +1. See
Figure 5-4
.
If there is a “strong” negative linear relationship between the variables,
the value of
will be close to -1. See
Figure 5-5
.
If there is little or no linear relationship between the variables, the value
of
will be close to 0. See
Figure 5-6
.
Figure 5-12
gives an idea about the range of the correlation coefficient
.
Observe that a “strong” negative linear association is appropriate when
-1
-0.8 and a “strong” positive linear association is appropriate
when +0.8
+1.
Click here for the Scatter Plot and Correlation Workbook