


 194 / 762

194
Chapter 5: Bivariate Data
( ) ( )( )
√{ ( ) ( )
} { ( ) ( )
}
=
√
= -0.9905965
-0.9906 (to four decimal places).
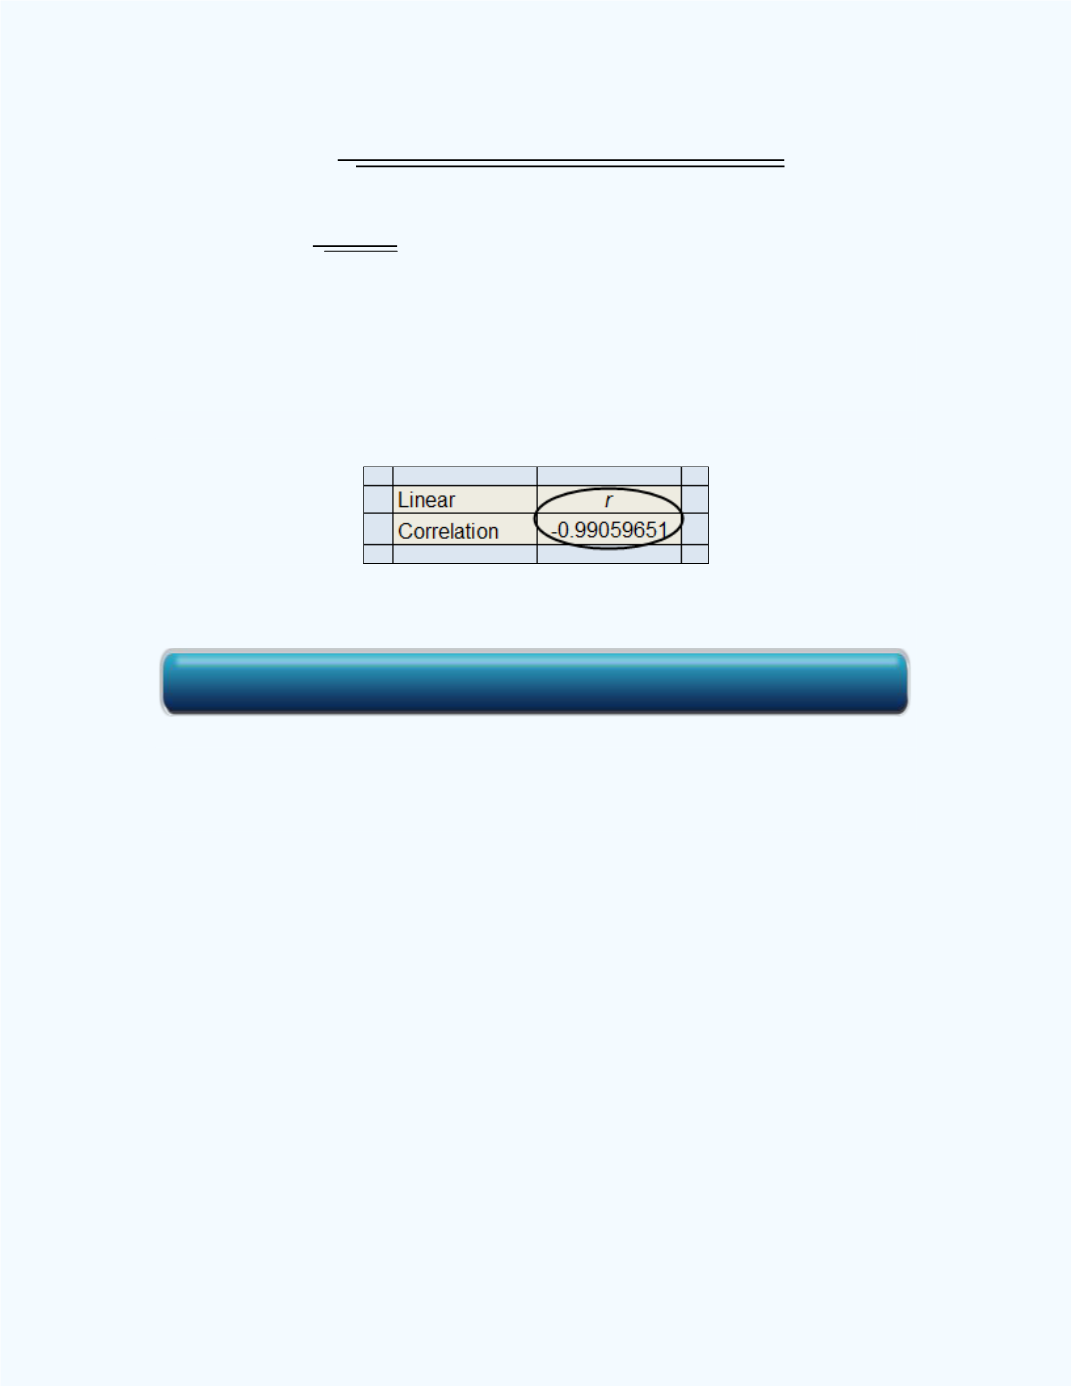
We can also use the
Simple Regression
workbook to compute this value.
Part of the output for this workbook with the linear correlation value is
shown
in Figure 5-8.
Observe that the correlation is negative.
Figure 5-8:
Linear correlation coefficient for
Example 5-2
The scatter plot for the data is shown in
Figure 5-9
. Observe that the plot
reveals a negative linear association which confirms the negative value for
the correlation coefficient.
Click here for the Simple Regression Workbook