


 192 / 762

192
Chapter 5: Bivariate Data
5-4 Linear Correlation
So far you have seen how a scatter plot can provide a visual of the
association between two quantitative variables. Here, we will discuss a
numerical measure of the linear association between two quantitative
variables called the
Pearson product moment correlation coefficient
.
We
will simply refer to this measure as the
correlation coefficient
.
First, we will define what we mean by the term correlation.
Definition: Correlation
Correlation is the statistical association or relationship between two or more
variables.
If the scatter plot displays a linear association between the two quantitative
variables, then we can quantify the association through a linear correlation
coefficient.
Definition: Linear Correlation Coefficient
The linear correlation coefficient measures the strength and gives the
direction of the linear relationship between two quantitative variables.
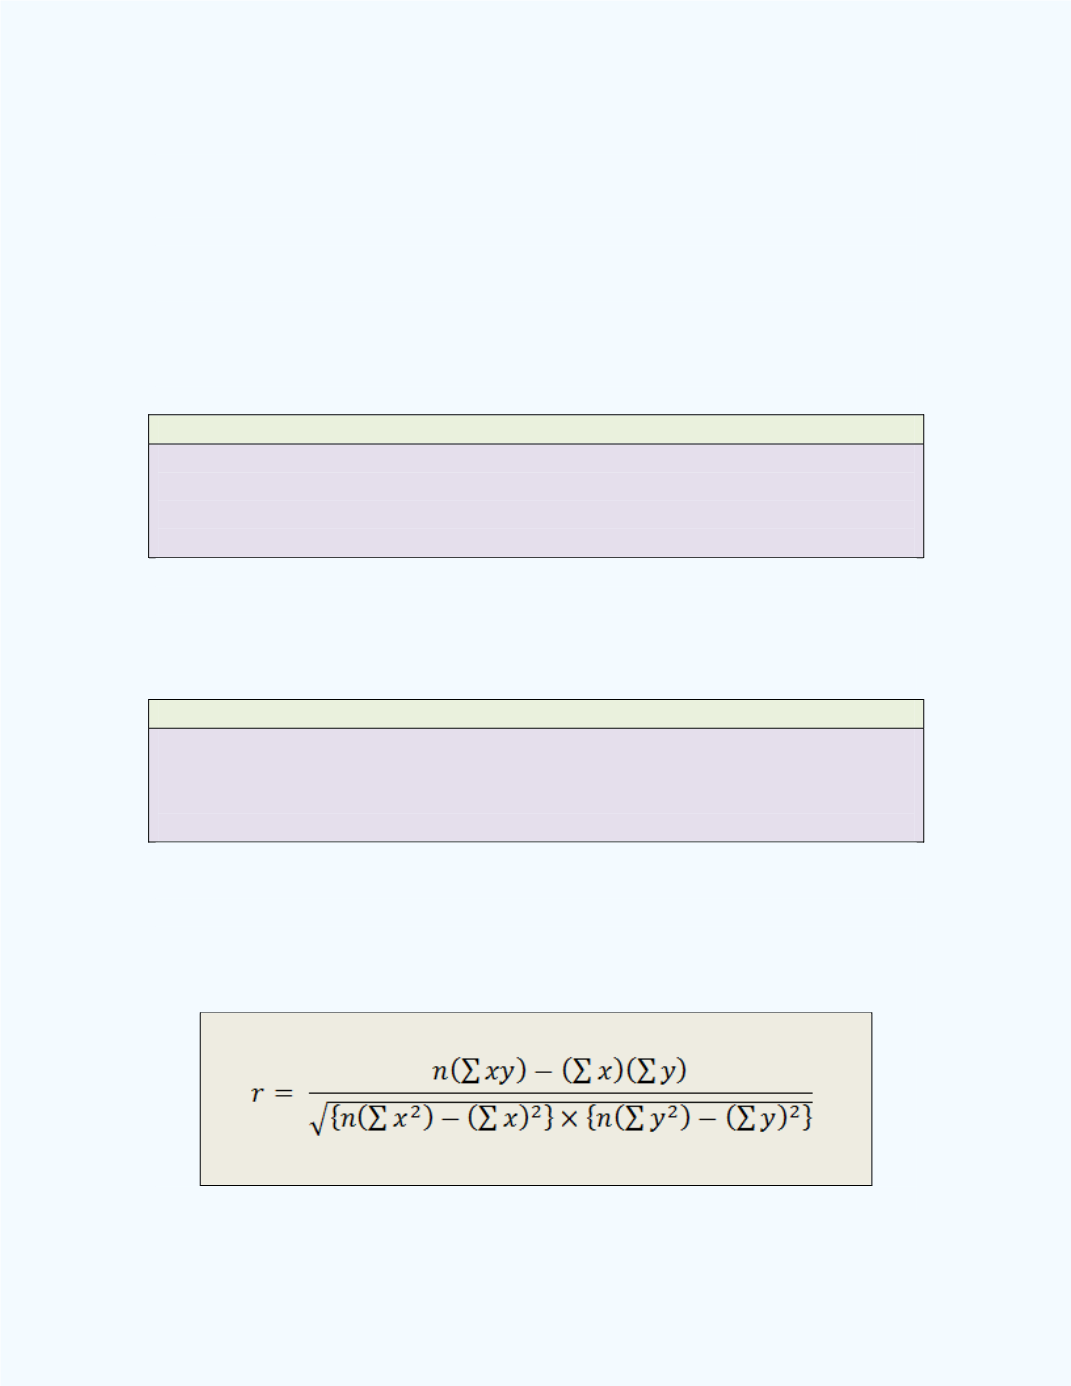
When we have sample data, then the linear correlation coefficient can be
computed by using the formula given below. Note the sample correlation
coefficient is denoted by the letter
. In the formula,
n
represents the
number of (
) pairs in the data set.