


 196 / 762

196
Chapter 5: Bivariate Data
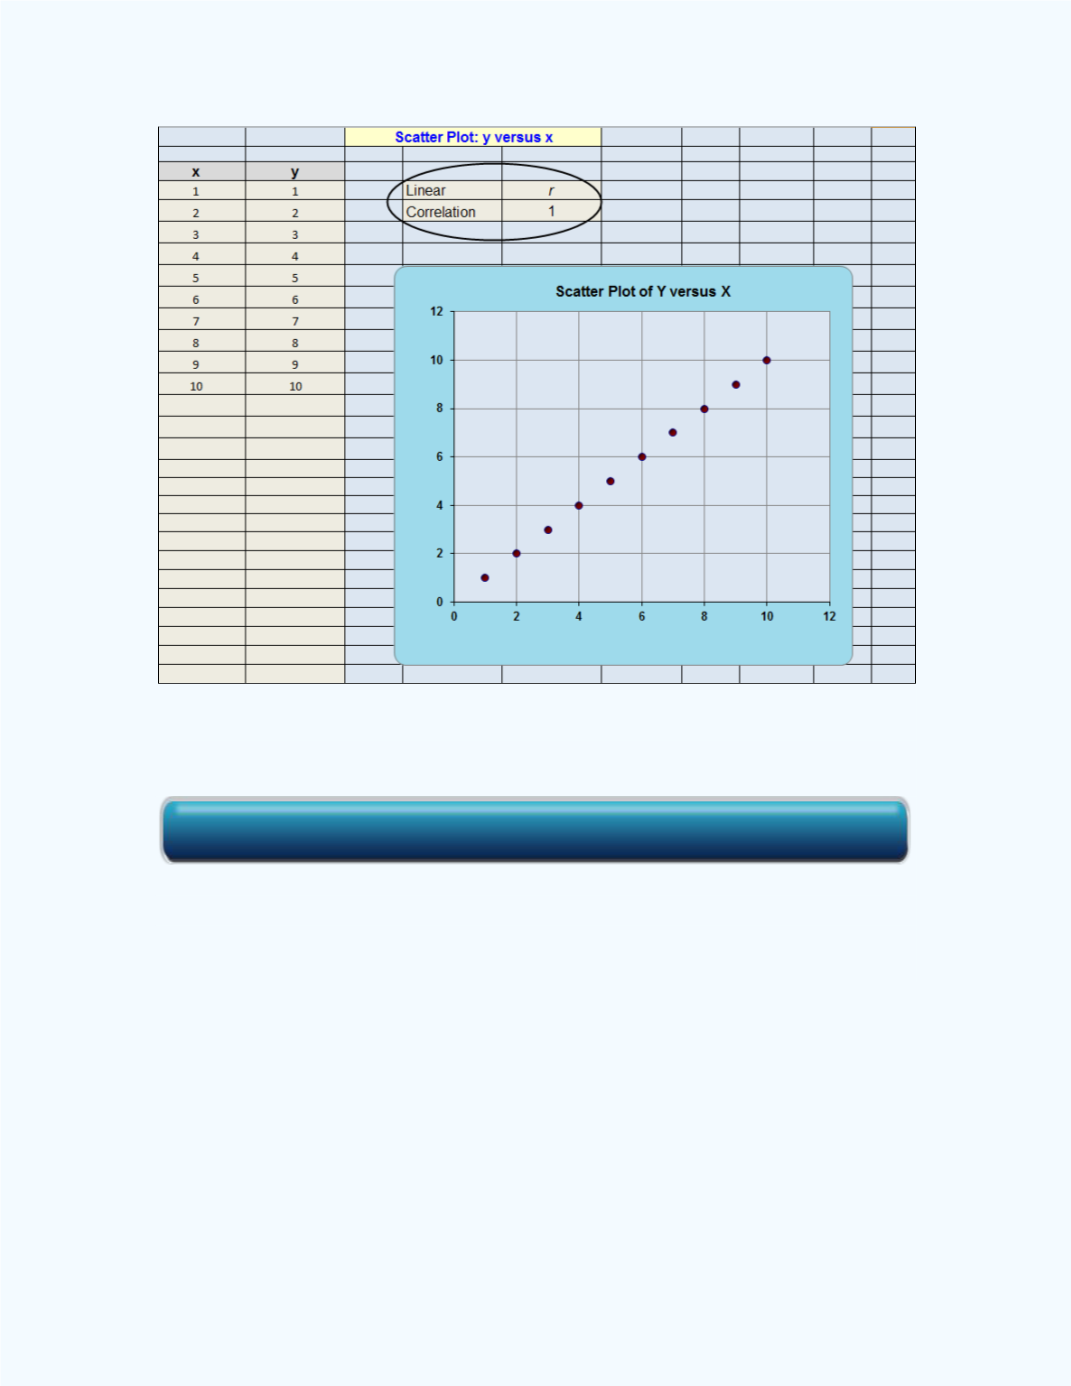
Figure 5-10:
Output showing the correlation coefficient of
+1 for a perfect positive association
If there is a perfect negative linear relationship between the variables, the
value of
will be equal to -1. See
Figure 5-11
.
Click here for the Scatter Plot and Correlation Workbook