


 335 / 762

Chapter 8: Discrete Probability Distributions
335
Notes:
Extensixve tables can be generated and used to find probabilities of
binomial random variables. The drawback, however, is that there is an
infinite number of values between 0 and 1 for the probability of
success, and therefore one would not have an exhaustive table for
reference.
Because of this, we choose to use appropriate technology.
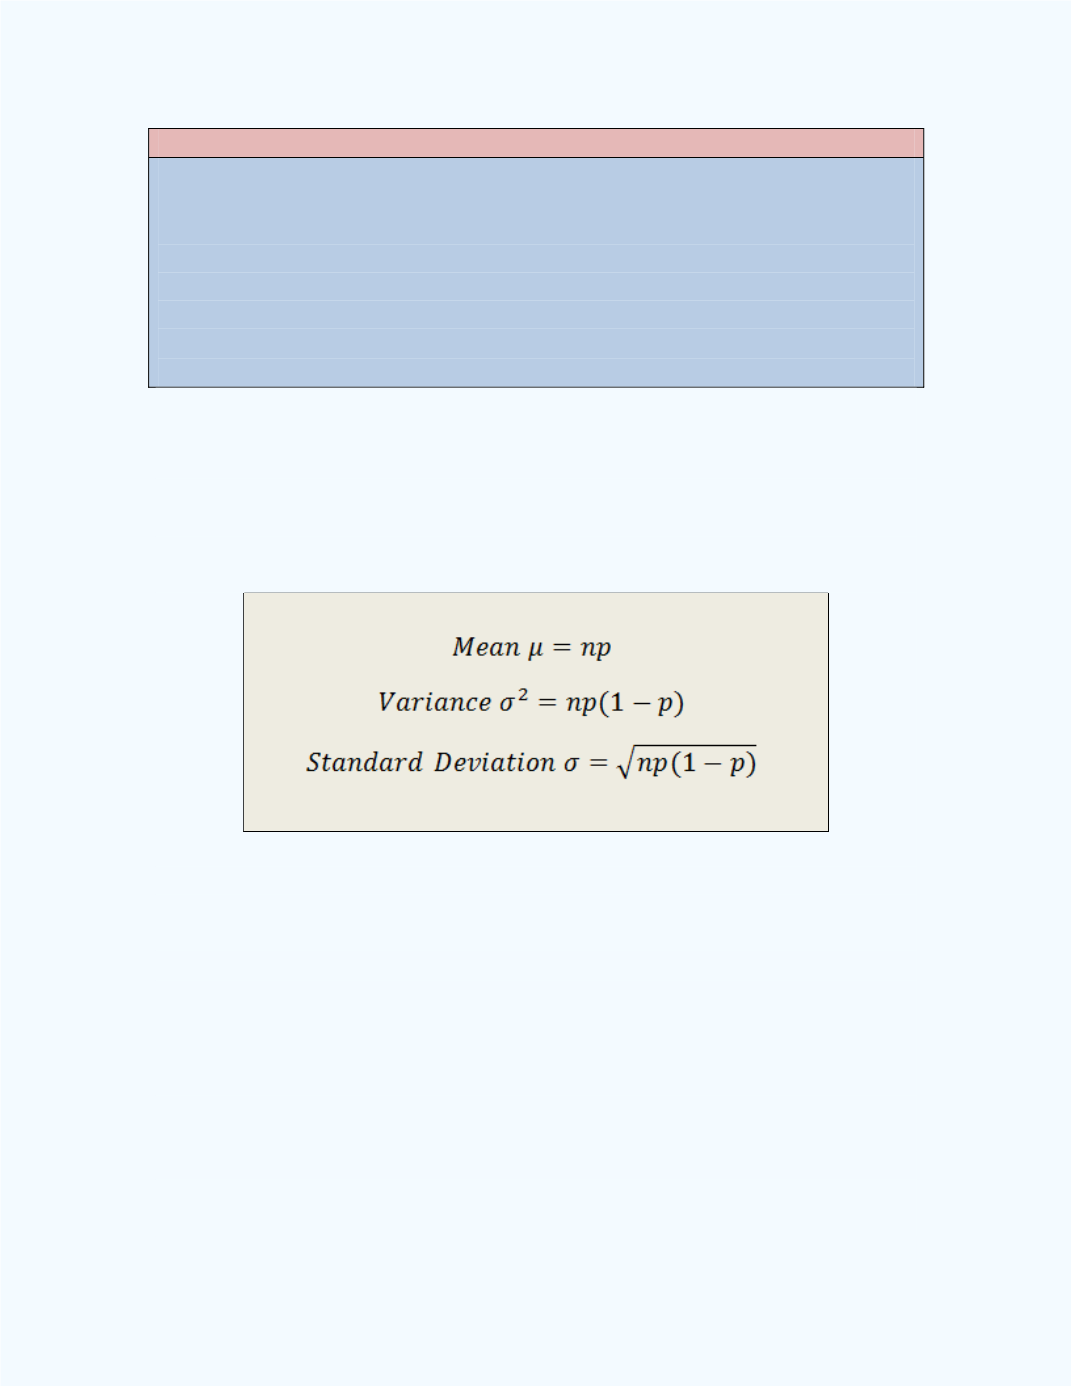
Mean (Expected Value), Variance and Standard Deviation for a
Binomial Random Variable
The mean, variance, and the standard deviation of a binomial random
variable can be computed using the following formulas.
Example 8-15
:
What is the expected value of the number of correct
guesses in
Example 8-14
?
Solution:
Since
then
= 12
0.25 = 3. That is, if the exam is
taken a repeated number of times, on average, the student will guess 3 of the
questions correctly.
Note:
We can use the
Binomial Probability Distribution
workbook to
solve all the problems relating to the binomial distribution in this section.
Example 8-16
:
Use the
Binomial Probability Distribution
workbook to
help find the solution for
Example 8-15.