


 664 / 762

664
Chapter 15: Chi-Square Tests
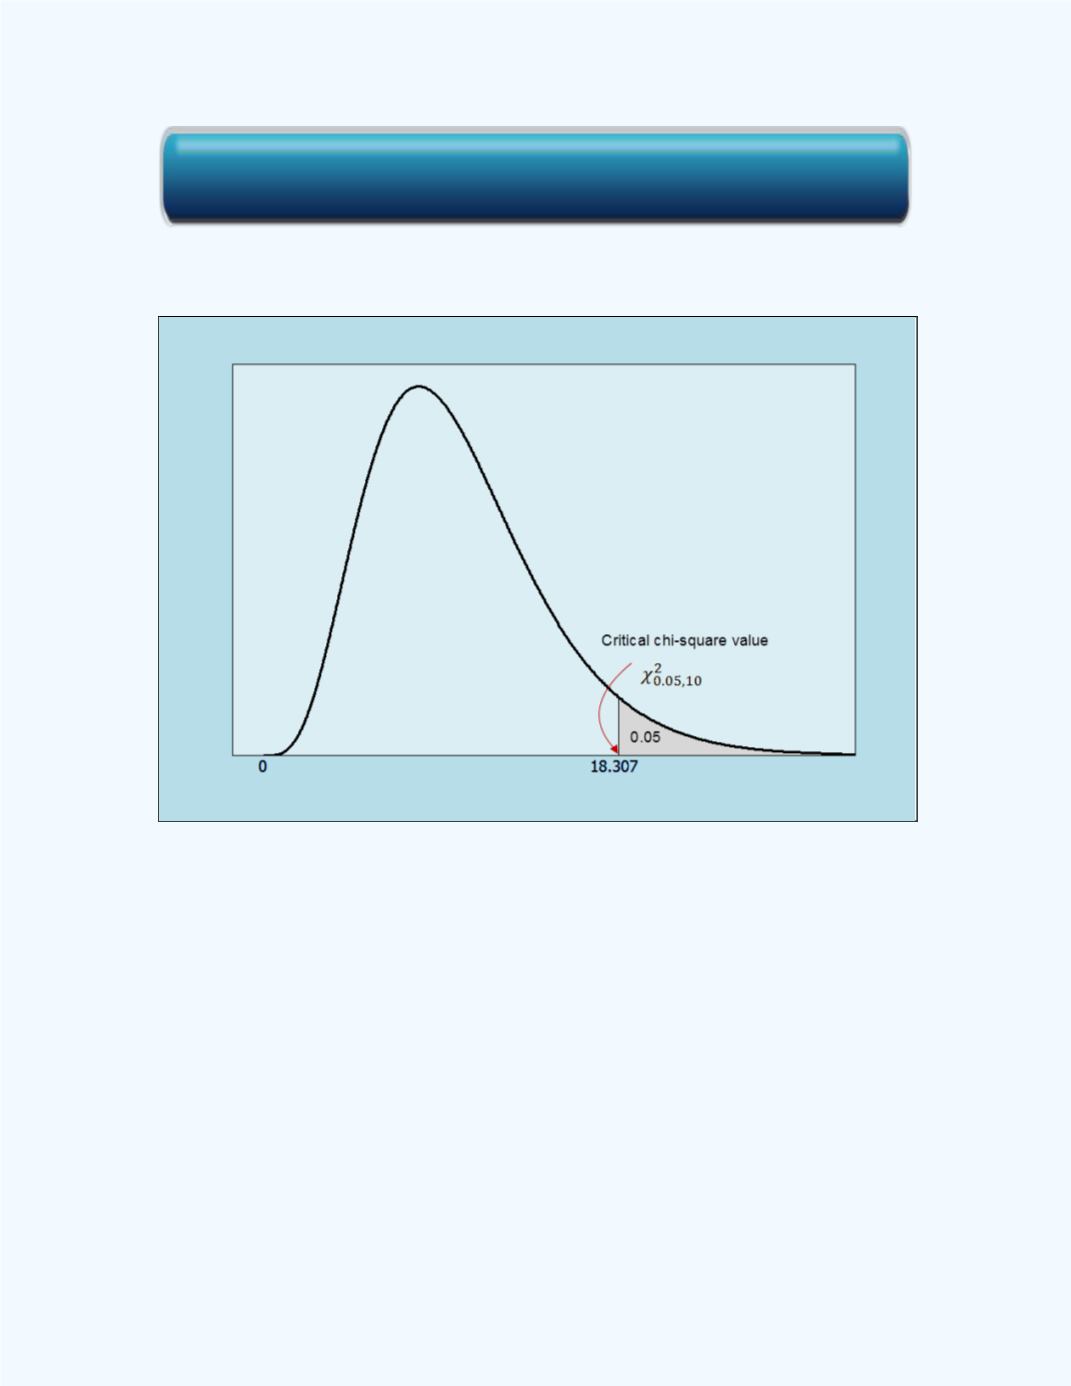
The shaded critical area is shown in
Figure 15-4
.
Figure 15-4:
Shaded Area for
Example 15.2:
What is the value of
?
Solution:
Fromthe
Critical Values for the Chi-Square Distribution
workbook, we have that
= 10.851. The portion of the table which
displays this is given in
Figure 15-5
. Observe that you have to enter a
degrees of freedom value of 20.
Click here for the Critical Values for the Chi-Square Distribution Workbook